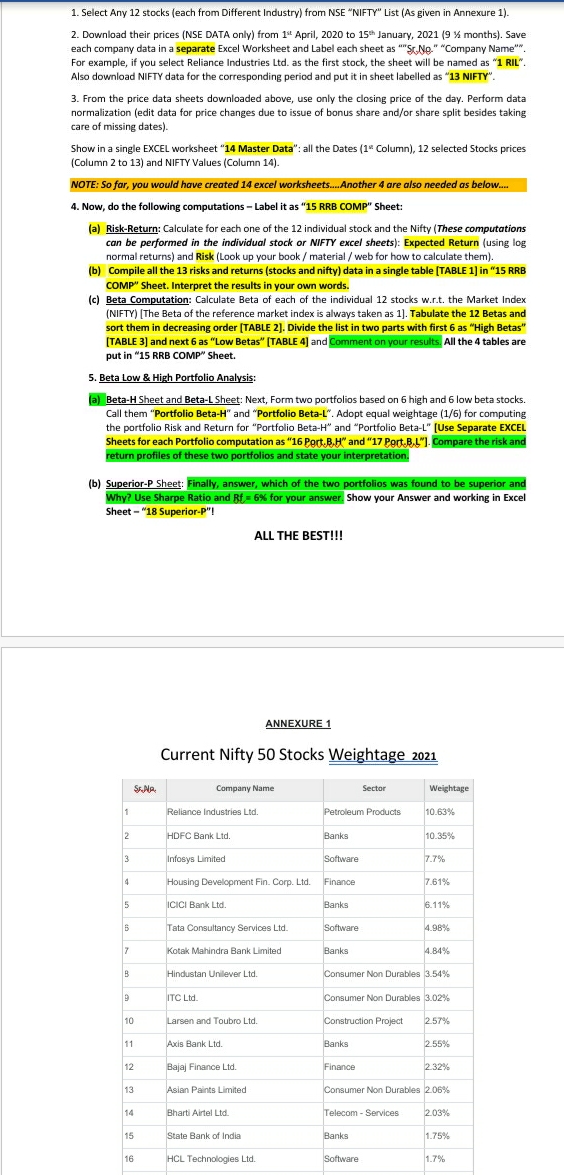
Question: please help 1. Select Any 12 stocks (each from Different Industry) from NSE NIFTY List (As given in Annexure 1). 2. Download their prices (NSE

please help

please help 1. Select Any 12 stocks (each from
1. Select Any 12 stocks (each from Different Industry) from NSE "NIFTY" List (As given in Annexure 1). 2. Download their prices (NSE DATA only) from 1" April, 2020 to 15 January, 2021 (9 %% months). Save each company data in a separate Excel Worksheet and Label each sheet as ""Sr,No." "Company Name"". For example, if you select Reliance Industries Led. as the first stock, the sheet will be named as "1 RIL" Also download NIFTY data for the corresponding period and put it in sheet labelled as "13 NIFTY". 3. From the price data sheets downloaded above, use only the closing price of the day. Perform data normalization (edit data for price changes due to issue of bonus share and/or share split besides taking care of missing dates). Show in a single EXCEL worksheet "14 Master Data": all the Dates (1" Column), 12 selected Stocks prices (Column 2 to 13) and NIFTY Values (Column 14). NOTE: So far, you would have created 14 excel worksheets.Another 4 are also needed as below. 4. Now, do the following computations - Label it as "15 RRB COMP" Sheet: (a) Risk-Return: Calculate for each one of the 12 individual stock and the Nifty (These computations can be performed in the individual stock or NIFTY excel sheets): Expected Return (using log normal returns) and Risk (Look up your book / material / web for how to calculate them) b) Compile all the 13 risks and returns (stocks and nifty) data in a single table [TABLE 1] in "15 RRB COMP" Sheet. Interpret the results in your own words. (c) Beta Computation: Calculate Beta of each of the individual 12 stocks w.r.t. the Market Index (NIFTY) [The Beta of the reference market index is always taken as 1]. Tabulate the 12 Betas and sort them in decreasing order [TABLE 2]. Divide the list in two parts with first 6 as "High Betas" [TABLE 3] and next 6 as "Low Betas" [TABLE 4] and Comment on your results. All the 4 tables are put in "15 RRB COMP" Sheet. 5. Beta Low & High Portfolio Analysis: (a) Beta-H Sheet and Beta-L Sheet: Next, Form two portfolios based on 6 high and 6 low beta stocks. Call them "Portfolio Beta-H" and "Portfolio Beta-L". Adopt equal weightage (1/6) for computing the portfolio Risk and Return for "Portfolio Beta-H" and "Portfolio Beta-L" [Use Separate EXCEL Sheets for each Portfolio computation as "16 Port. B.H" and "17 Port.B.L"]. Compare the risk and return profiles of these two portfolios and state your interpretation. (b) Superior-P Sheet: Finally, answer, which of the two portfolios was found to be superior and Why? Use Sharpe Ratio and Rf = 6%% for your answer Show your Answer and working in Excel Sheet - "18 Superior-P"! ALL THE BEST!!! ANNEXURE 1 Current Nifty 50 Stocks Weightage 2021 Company Name Sector Weightage 1 Reliance Industries Ltd. Petroleum Products 10.63%% HDFC Bank Lid. Banks 10.35% 3 Infosys Limited Software 7.7% 4 Housing Development Fin. Corp. Ltd. Finance 7.61% 5 ICICI Bank Ltd. Banks 6.11% Tata Consultancy Services Ltd. Software 4.98% 7 Kotak Mahindra Bank Limited Banks 4.84% Hindustan Unilever Ltd. Consumer Non Durables 3.54% ITC Ltd. Consumer Non Durables 3.02% Larsen and Toubro Ltd. Construction Project 2.57%% 11 Axis Bank Lid. Banks 2 55% 12 Bajaj Finance Ltd. Finance 2 32% 13 Asian Paints Limited Consumer Non Durables 206% 14 Bharti Airtel Ltd Telecom - Services 2.03% 15 State Bank of India Banks 1.75% 16 HCL Technologies Ltd. Software 1.7%

Step by Step Solution

There are 3 Steps involved in it

1 Expert Approved Answer
Step: 1 Unlock blur-text-image
Question Has Been Solved by an Expert!

Get step-by-step solutions from verified subject matter experts

Step: 2 Unlock
Step: 3 Unlock

Students Have Also Explored These Related Accounting Questions!