

Question: Please help! 1) [The graph below shows y = log,(x) (rightmost function in black) and a function transformed from it (leftmost function in green). There
Please help!
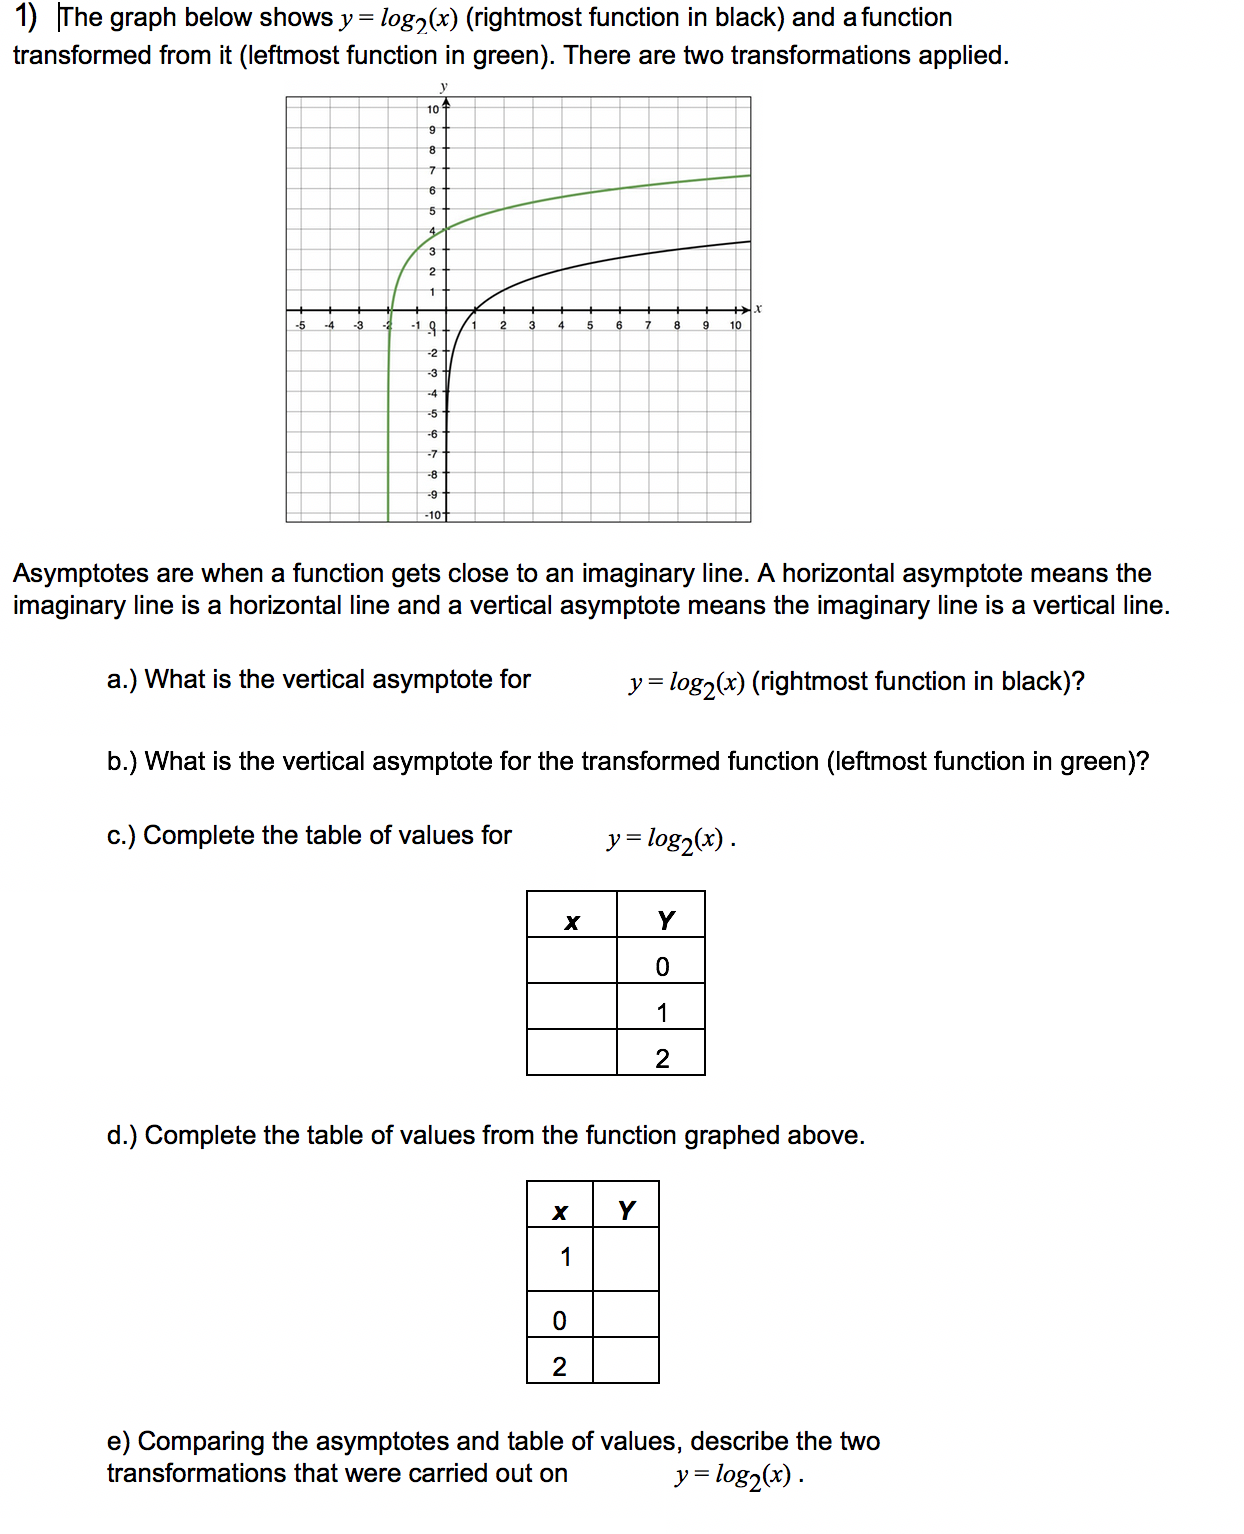
1) [The graph below shows y = log,(x) (rightmost function in black) and a function transformed from it (leftmost function in green). There are two transformations applied. -5 is is to 10 Asymptotes are when a function gets close to an imaginary line. A horizontal asymptote means the imaginary line is a horizontal line and a vertical asymptote means the imaginary line is a vertical line. a.) What is the vertical asymptote for y = log2(x) (rightmost function in black)? b.) What is the vertical asymptote for the transformed function (leftmost function in green)? c.) Complete the table of values for y = log2(x) . X Y d.) Complete the table of values from the function graphed above. X Y e) Comparing the asymptotes and table of values, describe the two transformations that were carried out on y = log2(x)
Step by Step Solution
There are 3 Steps involved in it

Get step-by-step solutions from verified subject matter experts