

Question: Please help 10. [-/1.02 Points] DETAILS WANEFMAC7 9.1.035. MY NOTES ASK YOUR TEACHER PRACTICE ANOTHER Stock Market Gyrations The following chart shows the day-by-day change,
![Please help 10. [-/1.02 Points] DETAILS WANEFMAC7 9.1.035. MY NOTES ASK](https://s3.amazonaws.com/si.experts.images/answers/2024/06/6667d4467ca59_5826667d446553fb.jpg)
Please help
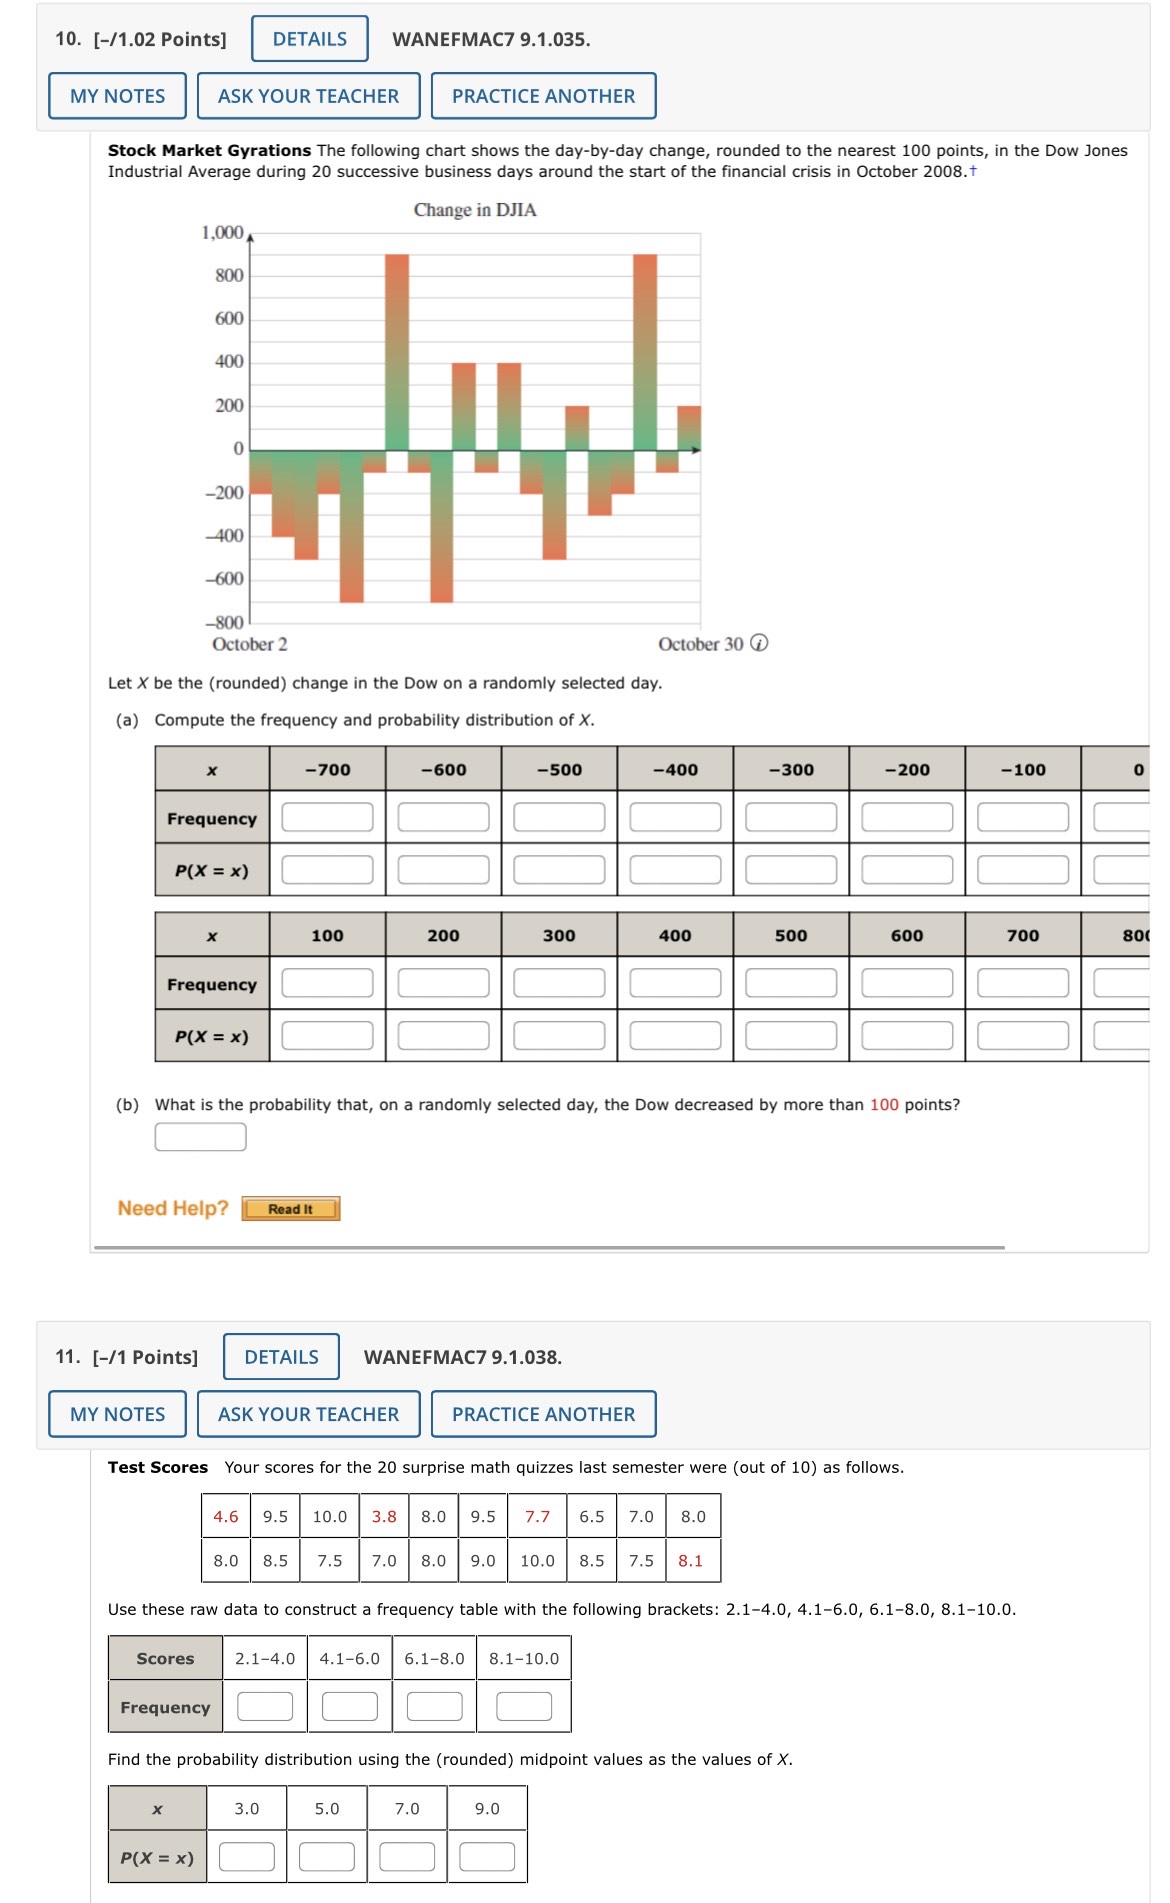
10. [-/1.02 Points] DETAILS WANEFMAC7 9.1.035. MY NOTES ASK YOUR TEACHER PRACTICE ANOTHER Stock Market Gyrations The following chart shows the day-by-day change, rounded to the nearest 100 points, in the Dow Jones Industrial Average during 20 successive business days around the start of the financial crisis in October 2008.t Change in DJIA 1,000 800 600 400 200 0 -200 400 -600 -800 October 2 October 30 @ Let X be the (rounded) change in the Dow on a randomly selected day. (a) Compute the frequency and probability distribution of X. -700 -600 -500 -400 -300 -200 -100 Frequency P(X = X) 100 200 300 400 500 600 700 80 Frequency P(X = x) (b) What is the probability that, on a randomly selected day, the Dow decreased by more than 100 points? Need Help? Read It 11. [-/1 Points] DETAILS WANEFMAC7 9.1.038. MY NOTES ASK YOUR TEACHER PRACTICE ANOTHER Test Scores Your scores for the 20 surprise math quizzes last semester were (out of 10) as follows. 4.6 9.5 10.0 3.8 8.0 9.5 7.7 6.5 7.0 8.0 8.0 8.5 7.5 7.0 8.0 9.0 10.0 8.5 7.5 8.1 Use these raw data to construct a frequency table with the following brackets: 2.1-4.0, 4.1-6.0, 6.1-8.0, 8.1-10.0. Scores 2.1-4.0 4.1-6.0 6.1-8.0 8.1-10.0 Frequency Find the probability distribution using the (rounded) midpoint values as the values of X. X 3.0 5.0 7.0 9.0 P(X = x)
Step by Step Solution
There are 3 Steps involved in it

Get step-by-step solutions from verified subject matter experts