

Question: Please Help: 10.3.1 Activity Activity 10.3 The Normal Curve and Probability Find the indicated area under the standard normal curve. 1. 2. 3. 4. 5.
Please Help: 10.3.1 Activity
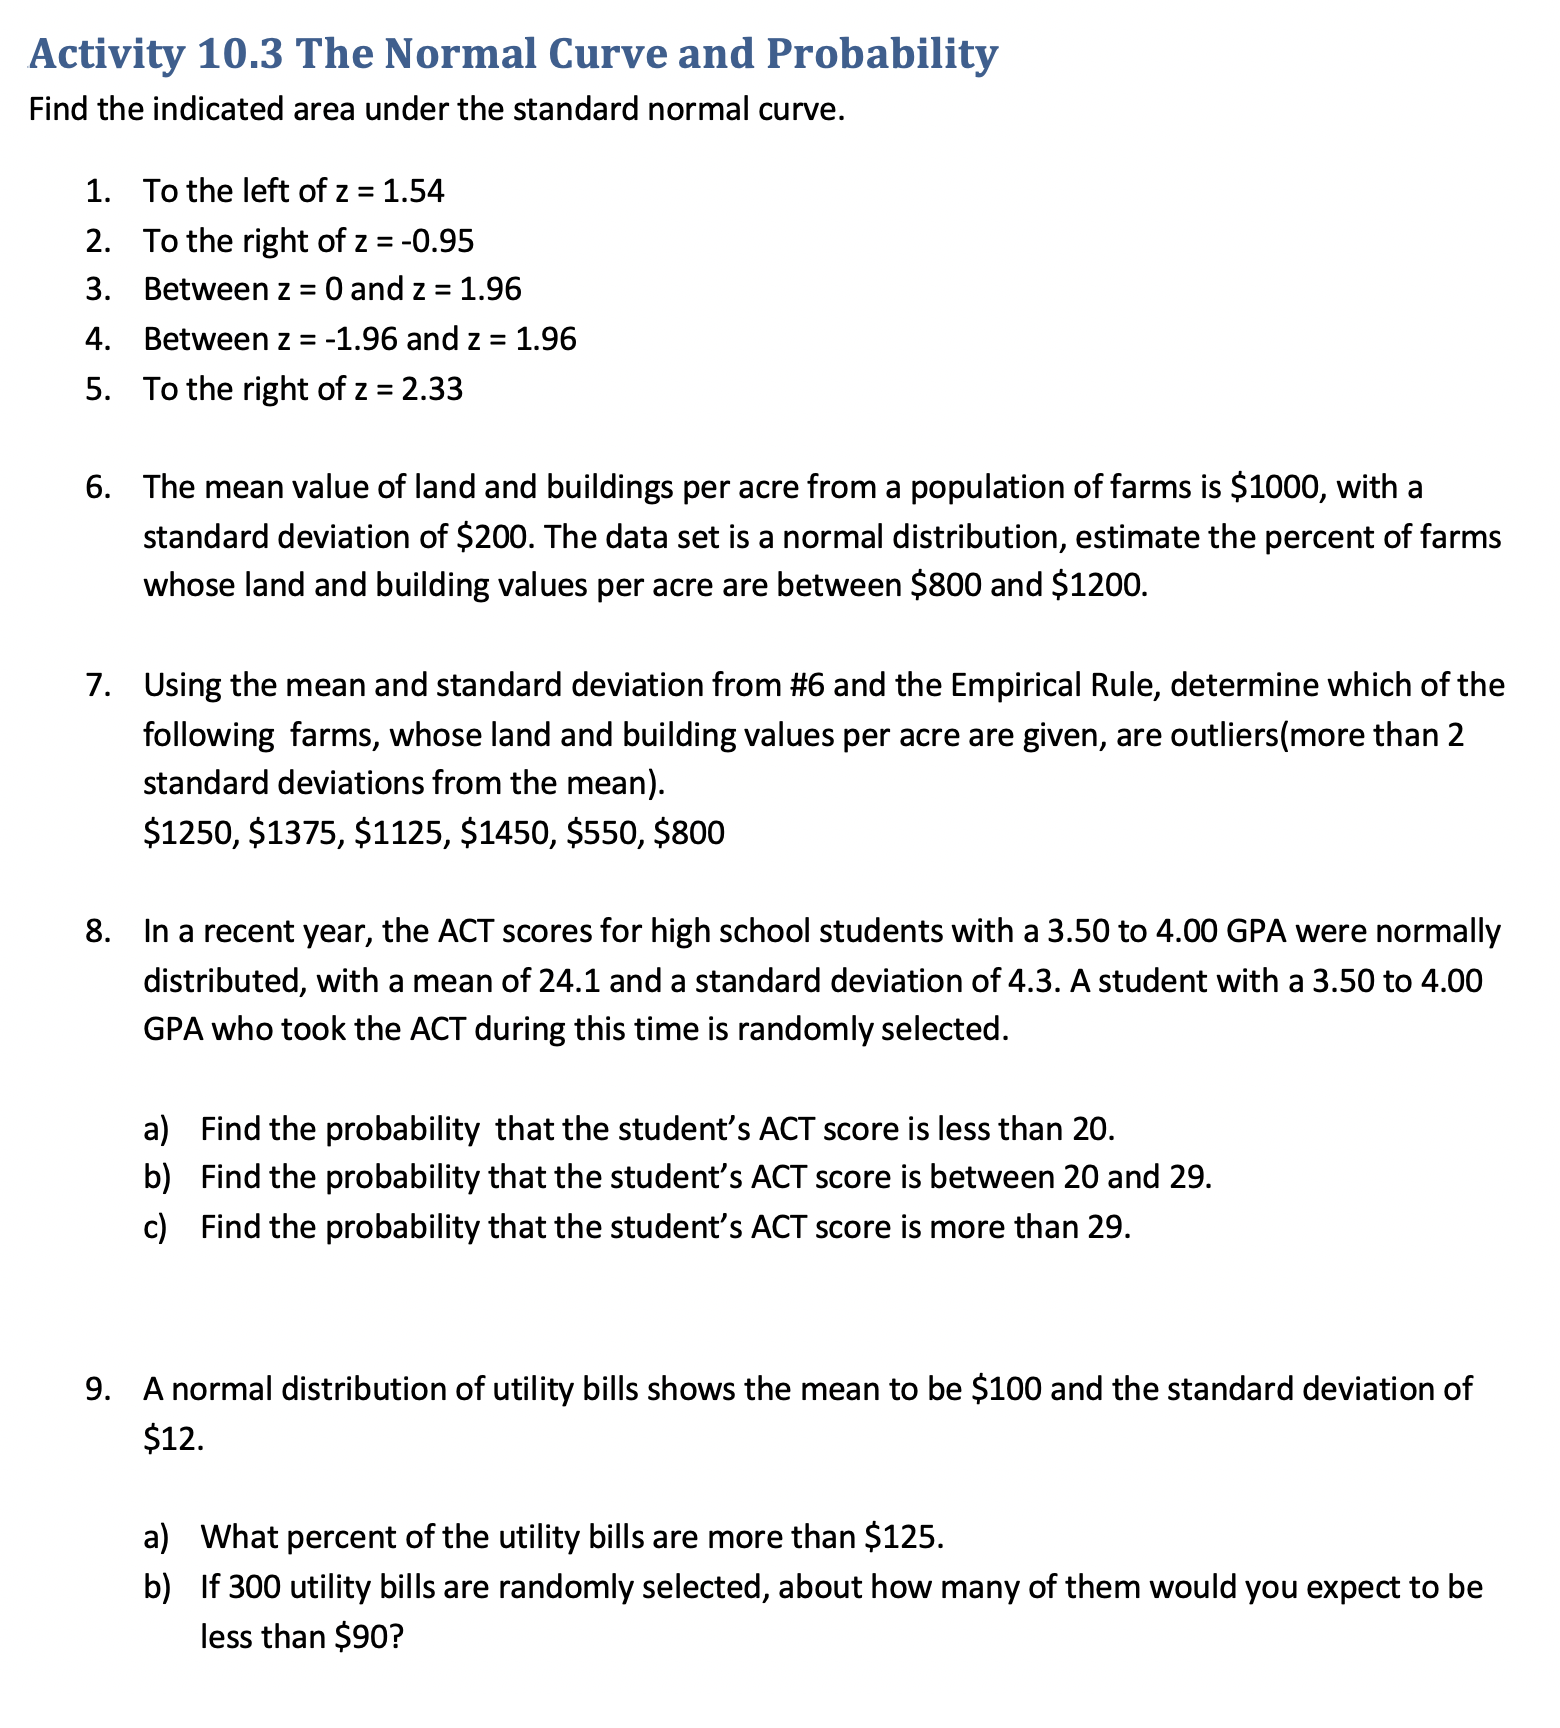
Activity 10.3 The Normal Curve and Probability Find the indicated area under the standard normal curve. 1. 2. 3. 4. 5. To the left of z = 1.54 To the right of z = -0.95 Between 2 = 0 and z = 1.96 Between 2 = -1.96 and z = 1.96 To the right of z = 2.33 The mean value of land and buildings per acre from a population of farms is $1000, with a standard deviation of $200. The data set is a normal distribution, estimate the percent of farms whose land and building values per acre are between $800 and $1200. Using the mean and standard deviation from #6 and the Empirical Rule, determine which of the following farms, whose land and building values per acre are given, are outliers(more than 2 standard deviations from the mean). $1250, $1375, $1125, $1450, $550, $800 In a recent year, the ACT scores for high school students with a 3.50 to 4.00 GPA were normally distributed, with a mean of 24.1 and a standard deviation of 4.3. A student with a 3.50 to 4.00 GPA who took the ACT during this time is randomly selected. a) Find the probability that the student's ACT score is less than 20. b) Find the probability that the student's ACT score is between 20 and 29. c) Find the probability that the student's ACT score is more than 29. A normal distribution of utility bills shows the mean to be $100 and the standard deviation of $12. a) What percent of the utility bills are more than $125. b) If 300 utility bills are randomly selected, about how many of them would you expect to be less than $90
Step by Step Solution
There are 3 Steps involved in it

Get step-by-step solutions from verified subject matter experts