

Question: Please Help 11. See Table 2.5 showing financial statement data and stock price data for Mydeco Corp. a. In what year was Mydeco's net income
Please Help
11.
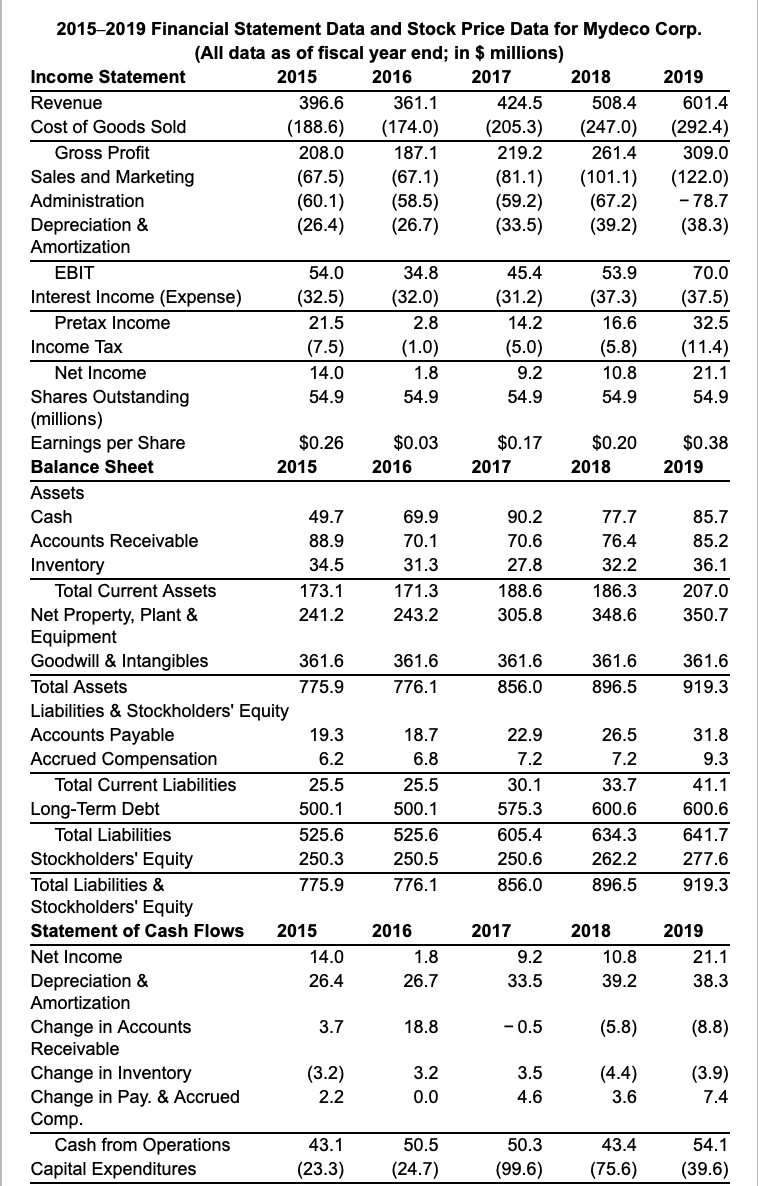
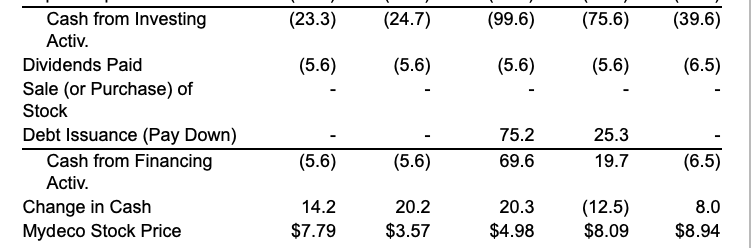
See Table 2.5 showing financial statement data and stock price data for Mydeco Corp. a. In what year was Mydeco's net income the lowest? b. In what year did Mydeco need to reduce its cash reserves? c. Why did Mydeco need to reduce its cash reserves in a year when net income was reasonably high? a. In what year was Mydeco's net income the lowest? (Select from the drop-down menus.) In (Net income was 34.5 2015-2019 Financial Statement Data and Stock Price Data for Mydeco Corp. (All data as of fiscal year end; in $ millions) Income Statement 2015 2016 2017 2018 2019 Revenue 396.6 361.1 424.5 508.4 601.4 Cost of Goods Sold (188.6) (174.0) (205.3) (247.0) (292.4) Gross Profit 208.0 187.1 219.2 261.4 309.0 Sales and Marketing (67.5) (67.1) (81.1) (101.1) (122.0) Administration (60.1) (58.5) (59.2) (67.2) - 78.7 Depreciation & (26.4) (26.7) (33.5) (39.2) (38.3) Amortization EBIT 54.0 34.8 45.4 53.9 70.0 Interest Income (Expense) (32.5) (32.0) (31.2) (37.3) (37.5) Pretax Income 21.5 2.8 14.2 16.6 32.5 Income Tax (7.5) (1.0) (5.0) (5.8) (11.4) Net Income 14.0 1.8 9.2 10.8 21.1 Shares Outstanding 54.9 54.9 54.9 54.9 54.9 (millions) Earnings per Share $0.26 $0.03 $0.17 $0.20 $0.38 Balance Sheet 2015 2016 2017 2018 2019 Assets Cash 49.7 69.9 90.2 77.7 85.7 Accounts Receivable 88.9 70.1 70.6 76.4 85.2 Inventory 31.3 27.8 32.2 36.1 Total Current Assets 173.1 171.3 188.6 186.3 207.0 Net Property, Plant & 241.2 243.2 305.8 348.6 350.7 Equipment Goodwill & Intangibles 361.6 361.6 361.6 361.6 361.6 Total Assets 775.9 776.1 856.0 896.5 919.3 Liabilities & Stockholders' Equity Accounts Payable 19.3 18.7 22.9 26.5 31.8 Accrued Compensation 6.2 6.8 7.2 7.2 9.3 Total Current Liabilities 25.5 25.5 30.1 33.7 41.1 Long-Term Debt 500.1 500.1 575.3 600.6 600.6 Total Liabilities 525.6 525.6 605.4 634.3 641.7 Stockholders' Equity 250.3 250.5 250.6 262.2 277.6 Total Liabilities & 775.9 776.1 856.0 896.5 919.3 Stockholders' Equity Statement of Cash Flows 2015 2016 2017 2018 2019 Net Income 14.0 1.8 9.2 10.8 21.1 Depreciation & 26.4 26.7 33.5 39.2 38.3 Amortization Change in Accounts 3.7 18.8 -0.5 (5.8) (8.8) Receivable Change in Inventory (3.2) 3.2 3.5 (4.4) (3.9) Change in Pay. & Accrued 2.2 0.0 4.6 3.6 7.4 Comp. Cash from Operations 43.1 50.5 50.3 43.4 54.1 Capital Expenditures (23.3) (24.7) (99.6) (75.6) (39.6) (23.3) (24.7) (99.6) (75.6) (39.6) (5.6) (5.6) (5.6) (5.6) (6.5) Cash from Investing Activ. Dividends Paid Sale (or Purchase) of Stock Debt Issuance (Pay Down) Cash from Financing Activ. Change in Cash Mydeco Stock Price 75.2 69.6 25.3 19.7 (5.6) (5.6) (6.5) 14.2 $7.79 20.2 $3.57 20.3 $4.98 (12.5) $8.09 8.0 $8.94
Step by Step Solution
There are 3 Steps involved in it

Get step-by-step solutions from verified subject matter experts