

Question: please help. 13. Application - Demand elasticity and agriculture Consider the market for corn. The following graph shows the weekly demand for corn and the
please help.
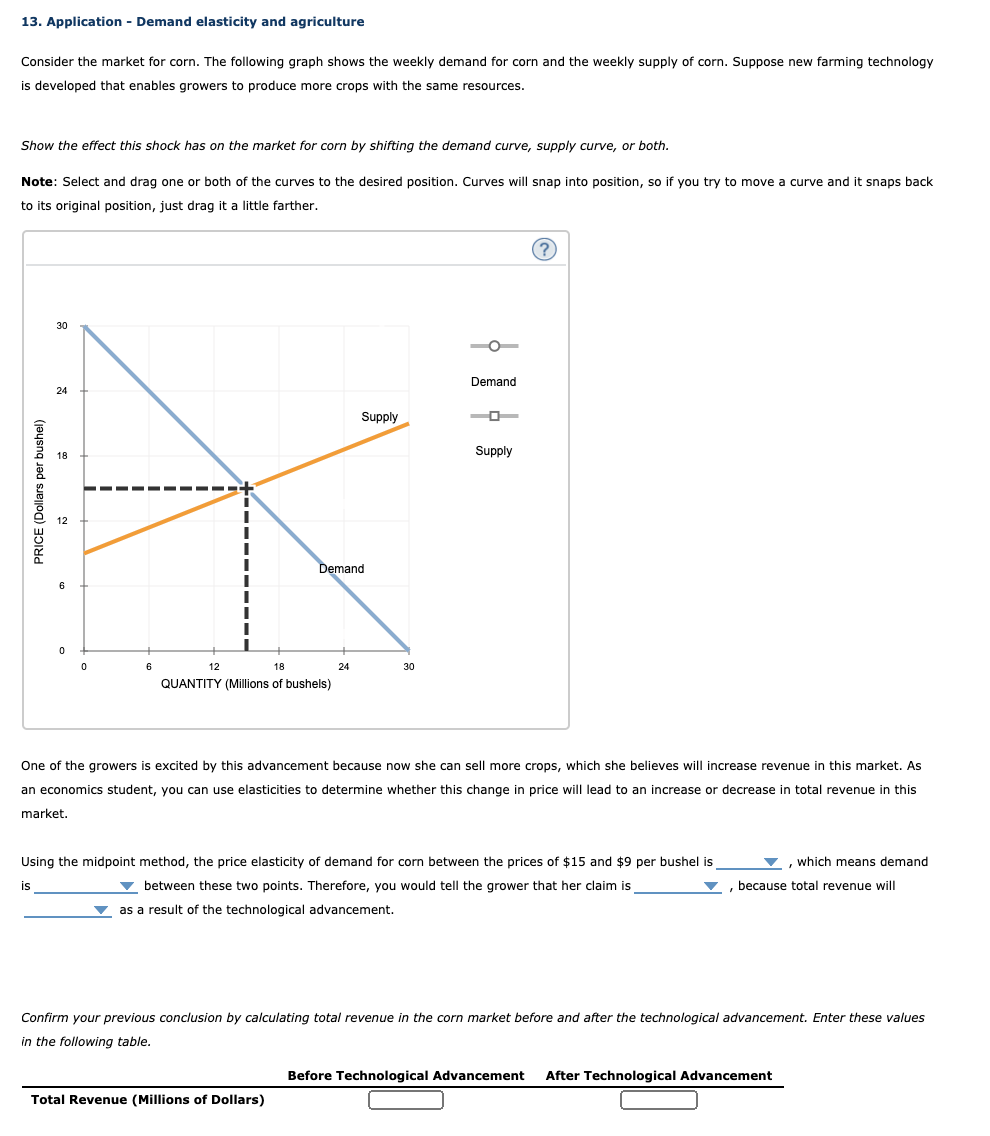
13. Application - Demand elasticity and agriculture Consider the market for corn. The following graph shows the weekly demand for corn and the weekly supply of corn. Suppose new farming technology is developed that enables growers to produce more crops with the same resources. Show the effect this shook has on the market for com by shining the demand curve, supply curve, or both. Note: Select and drag one or both of the curves to the desired position. Curves will snap into position, so if you try to move a curve and it snaps back to its original position, just drag it a little farther. CD so _0_ Demand 24 =. Sunni! |:| E U] 3 13 Supply 3. g - - - - - - - - + E I ._. 12 : u.I U E I I emend s I I I I o D B 12 1B 24 3|] QUANTITY (Millions of bushels) One of the growers is excited by this advancement because now she can sell more crops, which she believes will increase revenue in this market. As an economia student, you can use elasticities to determine whether this change in price will lead to an increase or decrease in total revenue in this market. Using the midpoint method, the price elasticity of demand for corn between the prices of $15 and $9 per bushel is V , which means demand is V between these two points. Therefore, you would tell the grower that her claim is V , because total revenue will V as a result of the technological advancement. Conrm your previous conclusion by calaxlating total revenue in the corn market before and alter the technological advancement. Enter these values in the Following table. Before Technological Advancement After Technologlcal Advancement Total Revenue (Millions of Dollars) [:] [:]
Step by Step Solution
There are 3 Steps involved in it

Get step-by-step solutions from verified subject matter experts