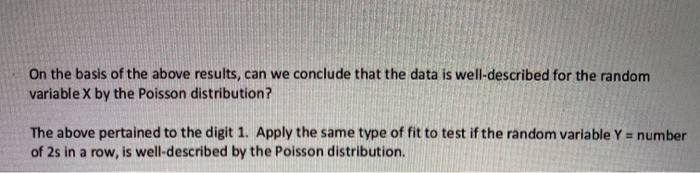
Question: please help 13.Poisson distribution Consider the data table in problem 1. Of a total of N=120 digits, 11 are 1s. Let X be the random
please help
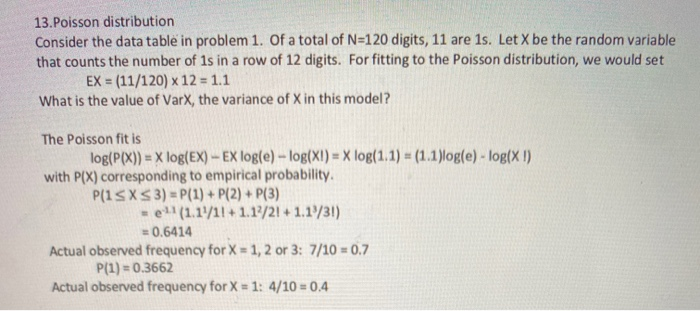
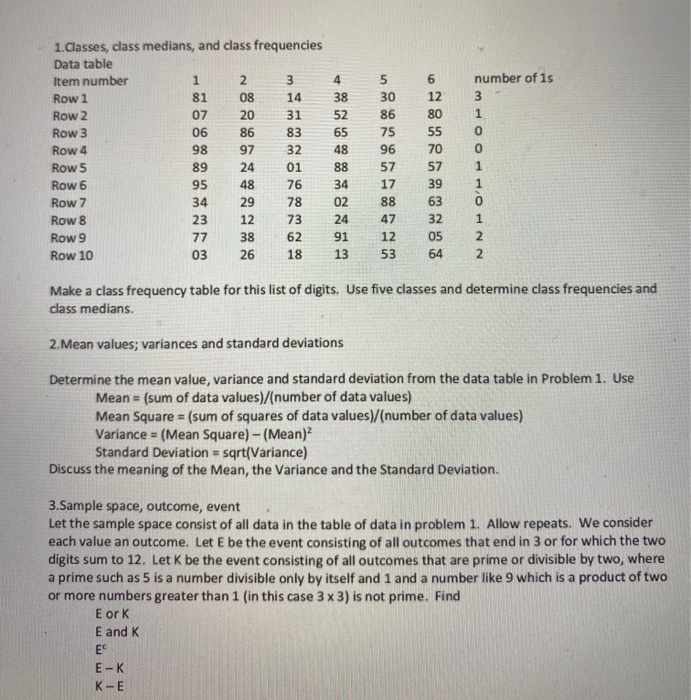
13.Poisson distribution Consider the data table in problem 1. Of a total of N=120 digits, 11 are 1s. Let X be the random variable that counts the number of 1s in a row of 12 digits. For fitting to the Poisson distribution, we would set EX = (11/120) x 12 = 1.1 What is the value of VarX, the variance of Xin this model? The Poisson fit is log(P(x)) = X log(EX) - Ex log(e) -log(XI) = X log(1.1) (1.1)log(e) - log(XI) with P(X) corresponding to empirical probability. P(1 SXS 3) = P(1) + P(2) + P(3) =e11(1.14/11 + 1.1/21 + 1.1/31) = 0.6414 Actual observed frequency for X = 1, 2 or 3: 7/10 = 0.7 P(1) -0.3662 Actual observed frequency for X = 1: 4/10 = 0,4 On the basis of the above results, can we conclude that the data is well-described for the random variable X by the Poisson distribution? The above pertained to the digit 1. Apply the same type of fit to test if the random variable Y = number of 2s in a row, is well-described by the Poisson distribution. number of 1s 3 1 1. Classes, class medians, and class frequencies Data table Item number 1 2 3 Row 1 81 08 14 Row 2 07 20 31 Row 3 06 86 83 Row 4 98 97 32 Row 5 89 24 01 Row 6 95 48 76 Row 7 34 29 78 Row 8 23 12 73 Row 9 77 38 62 Row 10 03 26 18 4 38 52 65 48 88 34 02 24 91 13 5 30 86 75 96 57 17 88 47 12 53 6 12 80 55 70 57 39 63 32 05 64 NN OPPOOW 1 Make a class frequency table for this list of digits. Use five classes and determine class frequencies and class medians. 2. Mean values; variances and standard deviations Determine the mean value, variance and standard deviation from the data table in Problem 1. Use Mean = (sum of data values)/(number of data values) Mean Square = (sum of squares of data values)/(number of data values) Variance = (Mean Square) - (Mean) Standard Deviation = sqrt(Variance) Discuss the meaning of the Mean, the Variance and the Standard Deviation. 3.Sample space, outcome, event Let the sample space consist of all data in the table of data in problem 1. Allow repeats. We consider each value an outcome. Let E be the event consisting of all outcomes that end in 3 or for which the two digits sum to 12. Let K be the event consisting of all outcomes that are prime or divisible by two, where a prime such as 5 is a number divisible only by itself and 1 and a number like 9 which is a product of two or more numbers greater than 1 (in this case 3 x 3) is not prime. Find E or K E and K ES E-K K-E 13.Poisson distribution Consider the data table in problem 1. Of a total of N=120 digits, 11 are 1s. Let X be the random variable that counts the number of 1s in a row of 12 digits. For fitting to the Poisson distribution, we would set EX = (11/120) x 12 = 1.1 What is the value of VarX, the variance of Xin this model? The Poisson fit is log(P(x)) = X log(EX) - Ex log(e) -log(XI) = X log(1.1) (1.1)log(e) - log(XI) with P(X) corresponding to empirical probability. P(1 SXS 3) = P(1) + P(2) + P(3) =e11(1.14/11 + 1.1/21 + 1.1/31) = 0.6414 Actual observed frequency for X = 1, 2 or 3: 7/10 = 0.7 P(1) -0.3662 Actual observed frequency for X = 1: 4/10 = 0,4 On the basis of the above results, can we conclude that the data is well-described for the random variable X by the Poisson distribution? The above pertained to the digit 1. Apply the same type of fit to test if the random variable Y = number of 2s in a row, is well-described by the Poisson distribution. number of 1s 3 1 1. Classes, class medians, and class frequencies Data table Item number 1 2 3 Row 1 81 08 14 Row 2 07 20 31 Row 3 06 86 83 Row 4 98 97 32 Row 5 89 24 01 Row 6 95 48 76 Row 7 34 29 78 Row 8 23 12 73 Row 9 77 38 62 Row 10 03 26 18 4 38 52 65 48 88 34 02 24 91 13 5 30 86 75 96 57 17 88 47 12 53 6 12 80 55 70 57 39 63 32 05 64 NN OPPOOW 1 Make a class frequency table for this list of digits. Use five classes and determine class frequencies and class medians. 2. Mean values; variances and standard deviations Determine the mean value, variance and standard deviation from the data table in Problem 1. Use Mean = (sum of data values)/(number of data values) Mean Square = (sum of squares of data values)/(number of data values) Variance = (Mean Square) - (Mean) Standard Deviation = sqrt(Variance) Discuss the meaning of the Mean, the Variance and the Standard Deviation. 3.Sample space, outcome, event Let the sample space consist of all data in the table of data in problem 1. Allow repeats. We consider each value an outcome. Let E be the event consisting of all outcomes that end in 3 or for which the two digits sum to 12. Let K be the event consisting of all outcomes that are prime or divisible by two, where a prime such as 5 is a number divisible only by itself and 1 and a number like 9 which is a product of two or more numbers greater than 1 (in this case 3 x 3) is not prime. Find E or K E and K ES E-K K-E