

Question: Please help! 2. Error Bars: Excel Supplement Part 2 has data from beams made from aluminum but with four different rectangular cross-sections. These cross-sections may
Please help!
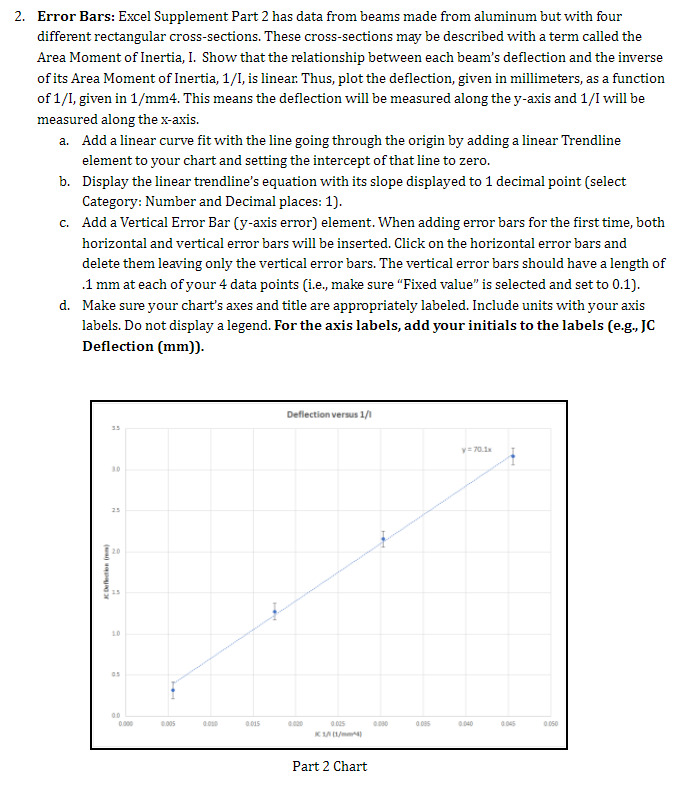

2. Error Bars: Excel Supplement Part 2 has data from beams made from aluminum but with four different rectangular cross-sections. These cross-sections may be described with a term called the Area Moment of Inertia, I. Show that the relationship between each beam's deflection and the inverse of its Area Moment of Inertia, 1/I, is linear. Thus, plot the deflection, given in millimeters, as a function of 1/1, given in 1/mm4. This means the deflection will be measured along the y-axis and 1/I will be measured along the x-axis. a. Add a linear curve fit with the line going through the origin by adding a linear Trendline element to your chart and setting the intercept of that line to zero. b. Display the linear trendline's equation with its slope displayed to 1 decimal point (select Category: Number and Decimal places: 1). c. Add a Vertical Error Bar (y-axis error) element. When adding error bars for the first time, both horizontal and vertical error bars will be inserted. Click on the horizontal error bars and delete them leaving only the vertical error bars. The vertical error bars should have a length of .1 mm at each of your 4 data points (i.e., make sure "Fixed value" is selected and set to 0.1). d. Make sure your chart's axes and title are appropriately labeled. Include units with your axis labels. Do not display a legend. For the axis labels, add your initials to the labels (e-g., JC Deflection (mm)). Deflection versus 1/1 35 y Korea 10 13 0.005 0.015 0.00 0085 0.040 0.050 0.005 1/01/ Part 2 Chart H J K L M A B C D E F G 1 Excel Charts Project Part 2 2 1. Create a scatter chart with the data in blue as described in the Excel Chart Project handout 3 2. For the axis labels, add your initials to the labels (e.g., JC Deflection (mm)). 4 5 6 7 Average Aluminum Beam Dimensions (mm) 8 Beam 1 Beam 2 Beam 3 9 Measurment base (b) height (h) base (b) height (h) base (b) height (h) 10 1 9.25 6.05 9.5 3 12.7 3.15 2 9.2 6.15 9.5 3 12.6 3.15 12 3 9.25 6.2 9.45 3.1 12.65 3.15 13 4 9.2 6.15 9.45 3 12.75 3.15 14 5 9.25 6.2 9.45 3.05 12.7 3.15 15 Average 9.23 6.15 9.47 3.03 12.68 3.15 16 17 18 Beam Deflection and Moment of inertia (500 g) Beam 4 base (b) height (h) 19.15 3.30 19.00 3.30 19.00 3.30 19.05 3.30 19.00 3.30 19.04 3.30 Beam Deflection (mm) 1 (mm^4) 1/1 (1/mm^4) 1 2 19 20 21 22 23 24 0.315 3.165 2.155 1.270 178.9 22.0 33.0 57.0 0.0056 0.0456 0.0303 0.0175 3 4 ar 2. Error Bars: Excel Supplement Part 2 has data from beams made from aluminum but with four different rectangular cross-sections. These cross-sections may be described with a term called the Area Moment of Inertia, I. Show that the relationship between each beam's deflection and the inverse of its Area Moment of Inertia, 1/I, is linear. Thus, plot the deflection, given in millimeters, as a function of 1/1, given in 1/mm4. This means the deflection will be measured along the y-axis and 1/I will be measured along the x-axis. a. Add a linear curve fit with the line going through the origin by adding a linear Trendline element to your chart and setting the intercept of that line to zero. b. Display the linear trendline's equation with its slope displayed to 1 decimal point (select Category: Number and Decimal places: 1). c. Add a Vertical Error Bar (y-axis error) element. When adding error bars for the first time, both horizontal and vertical error bars will be inserted. Click on the horizontal error bars and delete them leaving only the vertical error bars. The vertical error bars should have a length of .1 mm at each of your 4 data points (i.e., make sure "Fixed value" is selected and set to 0.1). d. Make sure your chart's axes and title are appropriately labeled. Include units with your axis labels. Do not display a legend. For the axis labels, add your initials to the labels (e-g., JC Deflection (mm)). Deflection versus 1/1 35 y Korea 10 13 0.005 0.015 0.00 0085 0.040 0.050 0.005 1/01/ Part 2 Chart H J K L M A B C D E F G 1 Excel Charts Project Part 2 2 1. Create a scatter chart with the data in blue as described in the Excel Chart Project handout 3 2. For the axis labels, add your initials to the labels (e.g., JC Deflection (mm)). 4 5 6 7 Average Aluminum Beam Dimensions (mm) 8 Beam 1 Beam 2 Beam 3 9 Measurment base (b) height (h) base (b) height (h) base (b) height (h) 10 1 9.25 6.05 9.5 3 12.7 3.15 2 9.2 6.15 9.5 3 12.6 3.15 12 3 9.25 6.2 9.45 3.1 12.65 3.15 13 4 9.2 6.15 9.45 3 12.75 3.15 14 5 9.25 6.2 9.45 3.05 12.7 3.15 15 Average 9.23 6.15 9.47 3.03 12.68 3.15 16 17 18 Beam Deflection and Moment of inertia (500 g) Beam 4 base (b) height (h) 19.15 3.30 19.00 3.30 19.00 3.30 19.05 3.30 19.00 3.30 19.04 3.30 Beam Deflection (mm) 1 (mm^4) 1/1 (1/mm^4) 1 2 19 20 21 22 23 24 0.315 3.165 2.155 1.270 178.9 22.0 33.0 57.0 0.0056 0.0456 0.0303 0.0175 3 4 ar
Step by Step Solution
There are 3 Steps involved in it

Get step-by-step solutions from verified subject matter experts