Question: please help! 2. Sample 1 Sample 2 Sample 3 Sample 4 Sample 5 Obs.1 16.35 16.93 16.05 16.20 16.90 Obs.2 16.21 16.25 16.00 16.10 16.11

please help! please help! 2. Sample 1 Sample 2 Sample 3 Sample
2. Sample 1 Sample 2 Sample 3 Sample 4 Sample 5 Obs.1 16.35 16.93 16.05 16.20 16.90 Obs.2 16.21 16.25 16.00 16.10 16.11 Obs.3 16.87 16.20 16.85 16.97 16.40 Obs.4 16.50 16.95 16.95 16.85 16.78 (1) Use the data above to construct a x-bar chart (3 points) and a R-chart (2) Is the production process in quality control? Why? (3) If the quality manager collects a new sample today with the following observation values: 16.50, 16.05, 17.95, 16.45 is the process still in control? Why

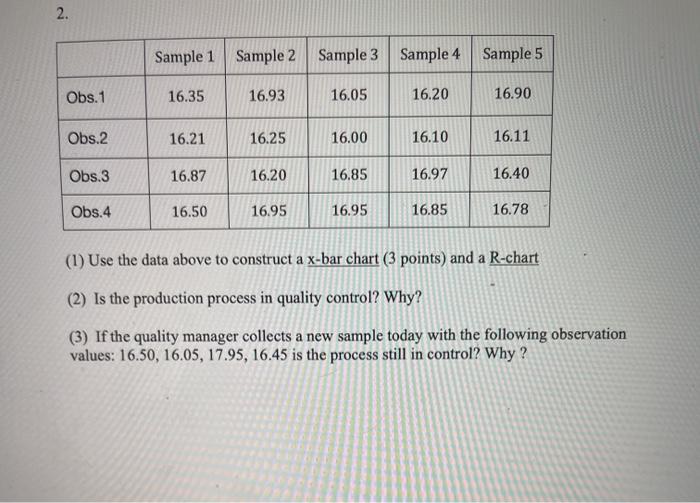
Step by Step Solution

There are 3 Steps involved in it

1 Expert Approved Answer
Step: 1 Unlock blur-text-image
Question Has Been Solved by an Expert!

Get step-by-step solutions from verified subject matter experts

Step: 2 Unlock
Step: 3 Unlock

Students Have Also Explored These Related General Management Questions!