

Question: please help 6.3 Applications of Normal Distributions. Problem 1. The average (mean) fuel efciency of U.S. light vehicles (cars, SUVs, minivans, vans, and light trucks)
please help
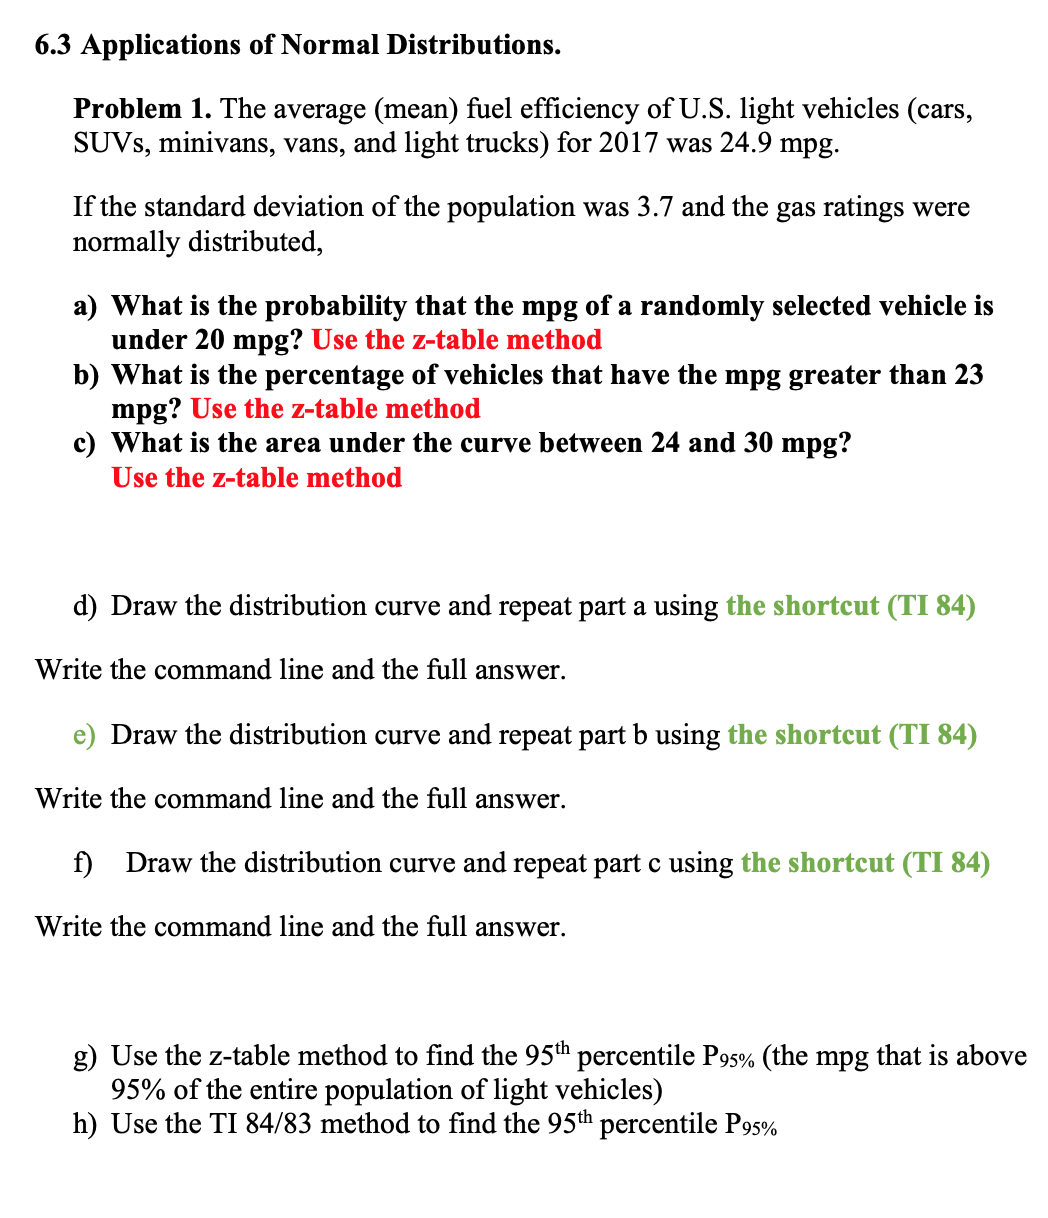
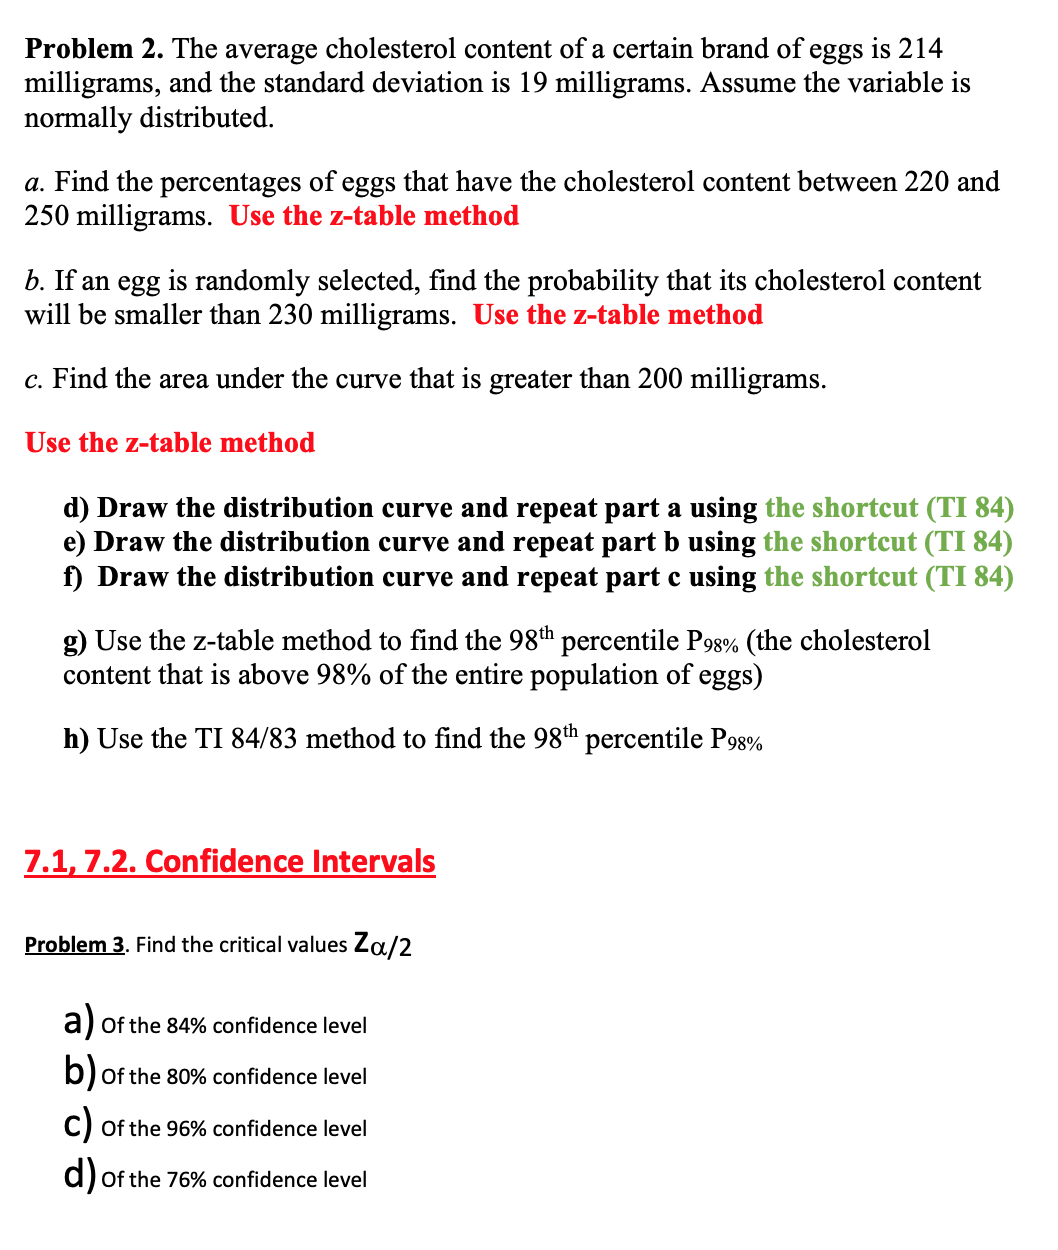
6.3 Applications of Normal Distributions. Problem 1. The average (mean) fuel efciency of U.S. light vehicles (cars, SUVs, minivans, vans, and light trucks) for 2017 was 24.9 mpg. If the standard deviation of the population was 3.7 and the gas ratings were normally distributed, a) What is the probability that the mpg of a randomly selected vehicle is under 20 mpg? Use the ztable method b) What is the percentage of vehicles that have the mpg greater than 23 mpg? Use the z-table method c) What is the area under the curve between 24 and 30 mpg? Use the z-table method d) Draw the distribution curve and repeat part a using the shortcut (TI 84) Write the command line and the full answer. e) Draw the distribution curve and repeat part b using the shortcut (TI 84) Write the command line and the full answer. 1) Draw the distribution curve and repeat part c using the shortcut (TI 84) Write the command line and the full answer. g) Use the ztable method to nd the 95th percentile P95% (the mpg that is above 95% of the entire population of light vehicles) h) Use the TI 84/83 method to nd the 95th percentile P9591, Problem 2. The average cholesterol content of a certain brand of eggs is 214 milligrams, and the standard deviation is 19 milligrams. Assume the variable is normally distributed. a. Find the percentages of eggs that have the cholesterol content between 220 and 250 milligrams. Use the z-table method b. If an egg is randomly selected, find the probability that its cholesterol content will be smaller than 230 milligrams. Use the z-table method c. Find the area under the curve that is greater than 200 milligrams. Use the z-table method d) Draw the distribution curve and repeat part a using the shortcut (TI 84) e) Draw the distribution curve and repeat part b using the shortcut (TI 84) () Draw the distribution curve and repeat part c using the shortcut (TI 84) g) Use the z-table method to find the 98 percentile P98% (the cholesterol content that is above 98% of the entire population of eggs) h) Use the TI 84/83 method to find the 98th percentile P98% 7.1, 7.2. Confidence Intervals Problem 3. Find the critical values Za/2 a) of the 84% confidence level b) of the 80% confidence level c) of the 96% confidence level d) of the 76% confidence level
Step by Step Solution
There are 3 Steps involved in it

Get step-by-step solutions from verified subject matter experts