

Question: Please Help!!!! 7.(2 points) What is the company's current, Basic EPS? Did EPS vary more than 10% from prior year? The companies' basic EPS for
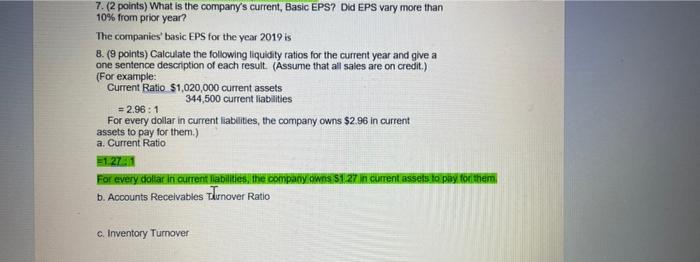
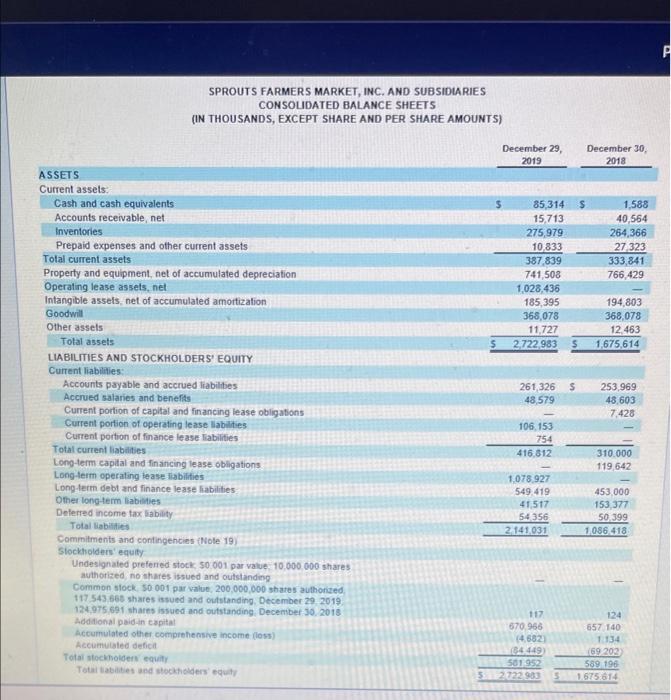
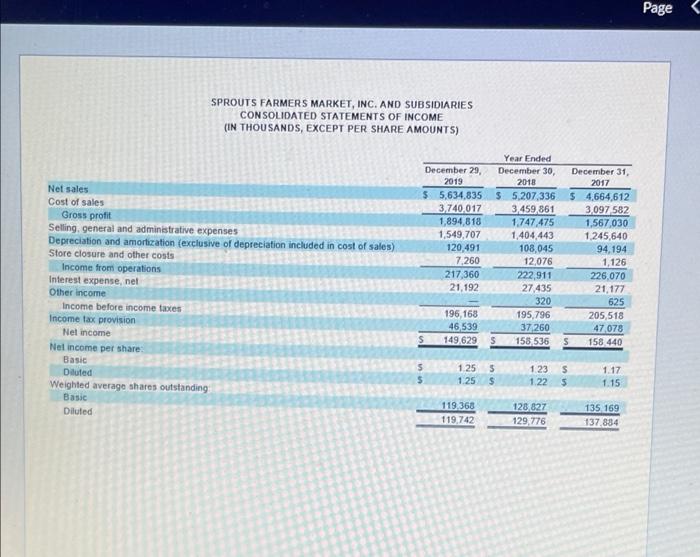
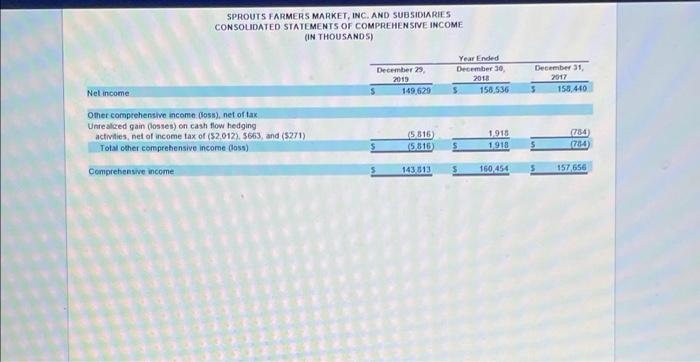
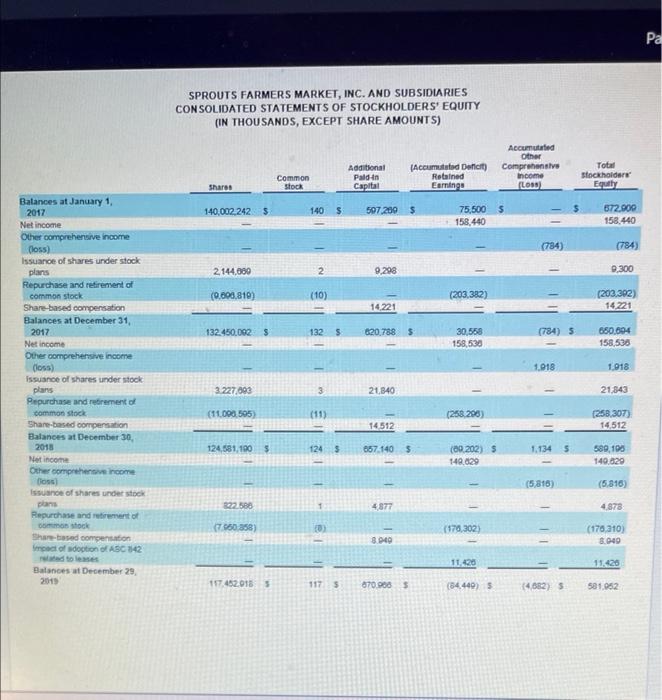
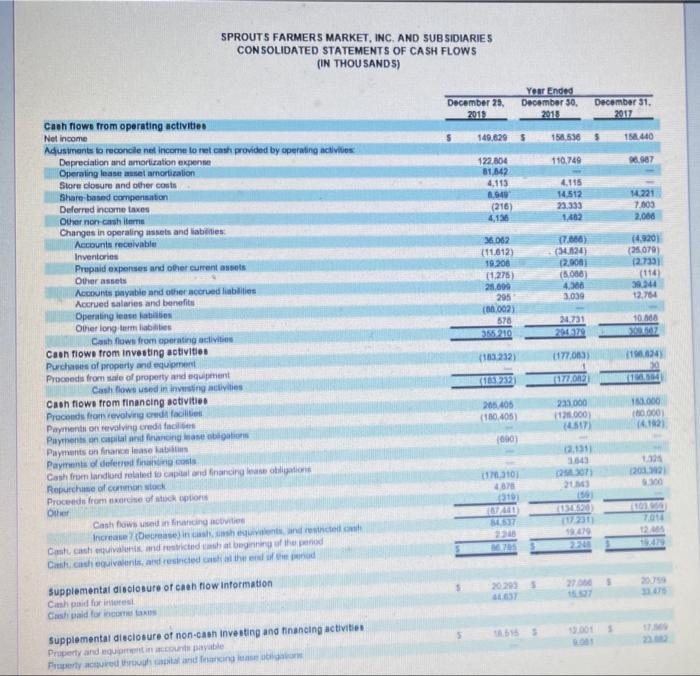
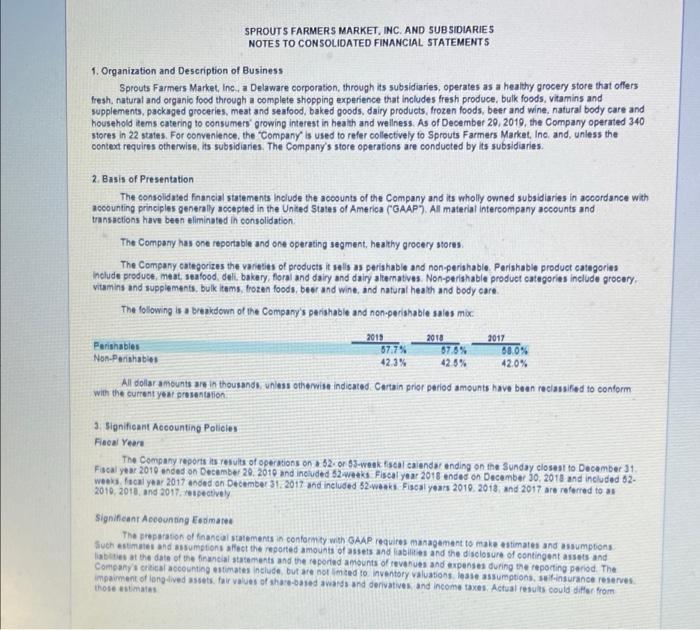
7.(2 points) What is the company's current, Basic EPS? Did EPS vary more than 10% from prior year? The companies' basic EPS for the year 2019 is 8. (9 points) Calculate the following liquidity ratios for the current year and give a one sentence description of each result (Assume that all sales are on credit.) (For example: Current Ratio $1,020,000 current assets 344,500 current liabilities = 2.96: 1 For every dollar in current liabilities, the company owns $2.96 in current assets to pay for them.) a. Current Ratio 51.271 For every dola in current liabilities, the company own 51.27in current assets to pay for them b. Accounts Receivables Turnover Ratio c. Inventory Turnover SPROUTS FARMERS MARKET, INC. AND SUBSIDIARIES CONSOLIDATED BALANCE SHEETS (IN THOUSANDS, EXCEPT SHARE AND PER SHARE AMOUNTS) December 29 2019 December 30, 2018 85,314 15,713 275,979 10.833 387,839 741,508 1,028,436 185,395 368,078 11,727 2,722 983 1,588 40,564 264,366 27 323 333,841 766.429 194,803 368,078 12.463 1,675,614 5 261,326 48,579 253,969 48,603 7,428 ASSETS Current assets Cash and cash equivalents Accounts receivable net Inventories Prepaid expenses and other current assets Total current assets Property and equipment, net of accumulated depreciation Operating lease assets, net Intangible assets, net of accumulated amortization Goodwill Other assels Total assets LIABILITIES AND STOCKHOLDERS' EQUITY Current liabilities: Accounts payable and accrued liabilities Accrued salaries and benefits Current portion of capital and financing lease obligations Current portion of operating lease abilities Current portion of finance lease liabilities Total current liabilities Long-term capital and financing lease obligations Long-term operating tease abilities Long-term debt and finance lease liabilities Other long-term abilities Deferred income tax liability Total abilities Commitments and contingencies Note 19) Stockholders' equity Undesignated preferred stock 50001 par value 10.000.000 shares authorized, no shares issued and outstanding Common stock. 50001 par value 200,000,000 shares authorized 117 543,560 shares issued and outstanding, December 29, 2019 124.975 691 shares issued and outstanding, December 30, 2018 Additional paid in capital Accumulated other comprehensive income (10) Accumulated deficit Total stockholders uity Totabilities and stockholders' equity 106.153 754 416.812 310.000 119 642 1,078 927 549.419 41,517 54 356 2141,031 453,000 153 377 50 399 1.086 418 117 670.956 (4.682 64 449 501952 32722930 124 657 140 1.134 169 202 589 198 5 1.675.614 Page SPROUTS FARMERS MARKET, INC. AND SUBSIDIARIES CONSOLIDATED STATEMENTS OF INCOME (IN THOUSANDS, EXCEPT PER SHARE AMOUNTS) December 29, 2019 $ 5,634.835 3,740.017 1,894,818 1,549,707 120.491 7.260 217,360 21.192 Net sales Cost of sales Gross profit Selling, general and administrative expenses Depreciation and amortization (exclusive of depreciation included in cost of sales) Store closure and other costs Income from operations Interest expense, nel Other income Income before income taxes Income tax provision Nel income Net income per share Basic Duted Weighted average shares outstanding Basic Diluted Year Ended December 30, 2018 $ 5,207,336 3.459.861 1.747,475 1,404 443 108,045 12,076 222,911 27,435 320 195,796 37 260 S 158 536 December 31, 2017 $ 4,664,612 3097 582 1,567,030 1.245,640 94,194 1,126 226,070 21,177 625 205,518 47,078 s 158 440 196,168 46 539 149 629 125 1.25 $ 5 $ 1.23 5 1.225 1.17 1.15 119.368 119,742 128 827 129,776 135 169 137.834 SPROUTS FARMERS MARKET, INC. AND SUBSIDIARIES CONSOLIDATED STATEMENTS OF COMPREHENSIVE INCOME (IN THOUSANDS) December 29 2019 149.629 Year Ended December 30 2013 158,536 December 31 2017 5 158.440 Net income Other comprehensive income (os), net of tak Unrealced gain (losses) on cash flow hedging activities, net of income tax of (2012). $663, and (5271) Total other comprehensive income osa) (5 815 15.816 1918 1918 784 (784) Comprehensive income 5 143813 160.454 157 656 Pa SPROUTS FARMERS MARKET, INC. AND SUBSIDIARIES CONSOLIDATED STATEMENTS OF STOCKHOLDERS' EQUITY (IN THOUSANDS, EXCEPT SHARE AMOUNTS) Additional Paldin Capital Common Stock Accumulated Other Comprehensive Income Low) [Accumulated Deficit) Retained Esmings Total stockholders Equity Shares 140,002,2425 140 597.259 $ $ 75.500 158.440 672.900 158.440 (784) (784) 2144,000 2 9.298 9.300 (0.600.810) (10) (203,382) (203.392) 14 221 14.221 132.450,092 $ 132 5 620.788 $ (784) S 30,558 158,538 650.604 158,536 1.018 1.018 Balances at January 1, 2017 Net income Other comprehensive income (loss) Issuance of shares understock plans Repurchase and retirement of common stock Share-based compensation Balances at December 31, 2017 Net income Other comprehensive income (loss) Issuance of shares understock plans Pepurchase and retirement of common stock Share-based compensation Balances at December 30, 2018 Net income Other comprehensive income Boss Issuance of shares understock plans Repurchase and retirement of on stock Share-based compensation impact of section of ASC 142 3 227,092 3 21840 21.843 1 & (11.000,595) (11) (258,290) 14512 (258.307) 14,512 124,581,100 $ 124 5 657 140 $ 1.134 5 (09.202) 5 140.029 589,105 149.820 (5,816) (5.816) 322588 1 4.877 4873 1 650 858) D (170,302) (170,210) 8.040 8.040 11.420 11.420 Balances at December 29 2015 117.462.015 1175 670.000 $ (84.440) 5 (4882) 5 581,052 SPROUTS FARMERS MARKET, INC. AND SUBSIDIARIES CONSOLIDATED STATEMENTS OF CASH FLOWS (IN THOUSANDS) December 25, 2011 Your Ended December 30, 2018 December 31. 2017 140.6295 158.536 5 11.440 110,749 6.987 122,804 81 342 4,113 1940 (216) 4,136 4115 14,512 23.333 1402 14.221 7.603 2.000 6062 (11.612) 19 200 (1.275) 28.000 295 (0.002) 578 365210 7.660) (124) 2.000 18.000 4.300 3,039 (4.9201 ( 25.079 (2.7331 (114 3244 12.784 24.731 10.000 UZ Cash flow from operating activities Net Income Adustments to reconcile net income to relcash provided by operating activities Depreciation and amortization experime Operating Inasemel amortization Store closure and other costs Share based compensation Deferred income taxes Other non-cashier Changes in operating assets and abilities: Accounts receivable Inventories Prepaid expenses and other current sets Other assets Accounts payable and other accruedlinbiles Accrued salaries and benefits Operating sa Other long-term liabilis Cash flows from operating activities Cash flows from investing activities Purchase of property and equipment Proceeds from sale of property and equipment Casowe used in investing activities Cash flow from financing sotivities Proceeds from revolving credito Payment on revolving credit facile Payment on and fining asos Payments on finance mase bits Payment offering co Cash from landlord related to and financing legione Repurchase of contoh Proceeds from of options Other Cashows used in mancing activiti Increase in the rest Cast cas equivalent and restricted at beginning of the end the Cascadh guivalents, and resided as the (1032321 1177.003) 1024 (1 252 205 405 (180405 233.000 112.000 517) 12.000 100 000 14.12 000) 02.131 3643 2011 21 2009 SEX 1310 4815 (310 1740 53 70 2 9 M 3 2015 65 Supplemental disclosure of cash flow information Cash paid for interes Cash bald for income tax 5 . Supplemental disclosure of non-cash investing and financing activities Property and inte Proty sure that incing SPROUTS FARMERS MARKET, INC. AND SUBSIDIARIES NOTES TO CONSOLIDATED FINANCIAL STATEMENTS 1. Organization and Description of Business Sprouts Farmers Market, Inc., a Delaware corporation, through its subsidiaries, operates as a healthy grocery store that offers fresh, natural and organic food through a complete shopping experience that includes fresh produce, bulk foods, vitamins and supplements, packaged groceries, meat and seafood, baked goods, dairy products, frozen foods, beer and wine, natural body care and household items catering to consumers' growing interest in health and wellness. As of December 29, 2010, the Company operated 340 stores in 22 states. For convenience, the Company is used to refer collectively to Sprouts Farmers Market, Inc. and, unless the context requires otherwise, its subsidiaries. The company's store operations are conducted by its subsidiaries. 2. Basis of Presentation The consolidated Financial statements include the accounts of the Company and its wholly owned subsidiaries in accordance with accounting principles generally accepted in the United States of America ("GAAP). Al material intercompany accounts and transactions have been eliminated in consolidation The Company has one reportable and one operating segment, healthy grocery stores The Company categorizes the varieties of products itses us perishable and non-perishable Parishable product categories include produce, meat, seafood deli, bakery, floral and dairy and dairy alternatives. Non-perishable product categories include grocery vitamins and supplements, bulk itams, frozen foods, beer and wine, and natural health and body care. The following is a breakdown of the Company's perishable and non-perishable sales mix 2013 2017 Perishables 57.7% 87.5% 88.0% Non-Parinhabis 423% 42.6% 42,0% Al dollar amounts are in thousands, unless otherwise indicated. Certain prior period amounts have been reclassified to conform with the current your presentation 2018 3. Significant Accounting Policies Facal Year The Company reports its results of operations on 2 or 3-week scal calendar ending on the Sunday closest to December 31 Facal year 2010 ended on December 29, 2010 and included 52: Fiscal year 2018 ended on December 30, 2018 and included 02- was focal you 2017 ended on December 31, 2017 and included 82ks Fiscal years 2010, 2018 and 2017 are referred to an 2010, 2018 and 2017, el pectively Significant Accounting Eesmanee The preparation of financal statements in conformity with GAAP requires management to make estimates and assumptions Suches and assumptions at the reported amounts of assets and liabilities and the disclosure of contingent assets and late at the date of the financial statements and the reported amounts of revenues and expenses during the reporting period. The Company's critical accounting estimates include but are not limited to inventory Valuation losse assumptions, insurance reserves impairment of long-lived assets. fair values of share-based awards and derivatives and income taxes Actual results could differ from those estimates
Step by Step Solution
There are 3 Steps involved in it

Get step-by-step solutions from verified subject matter experts