

Question: Please help A 10-year study conducted by the American Heart Association provided data on how age and blood pressure relate to the risk of strokes.
Please help
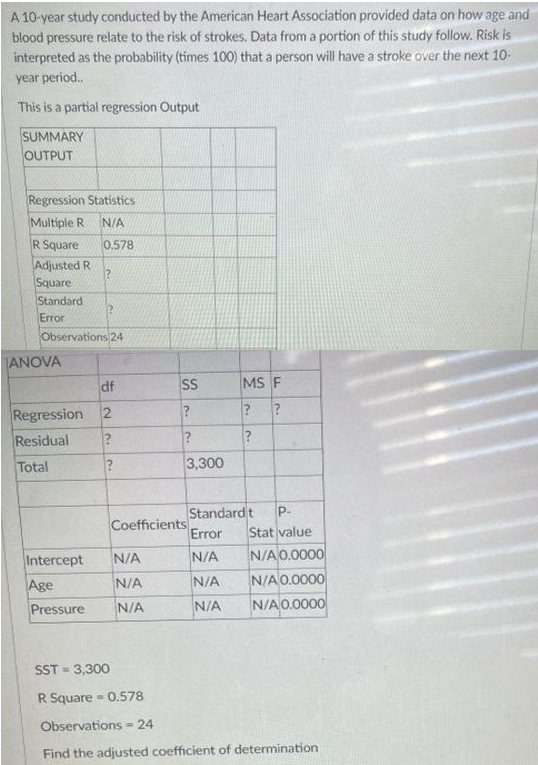
A 10-year study conducted by the American Heart Association provided data on how age and blood pressure relate to the risk of strokes. Data from a portion of this study follow. Risk is interpreted as the probability (times 100) that a person will have a stroke over the next 10- year period.. This is a partial regression Output SUMMARY OUTPUT Regression Statistics Multiple R IN/A R Square 0.578 Adjusted R Square Standard Error Observations 24 ANOVA df SS MS F Regression 2 ? ? Residual ? Total ? 3.300 Standard t P Coefficients Error Stat value Intercept N/A N/A N/A 0.0000 Age N/A N/A N/A 0.0000 Pressure N/A N/A N/A 0.0000 SST = 3,300 R Square = 0.578 Observations = 24 Find the adjusted coefficient of determination
Step by Step Solution
There are 3 Steps involved in it

Get step-by-step solutions from verified subject matter experts