

Question: please help A study was done on proctored and nonproctored tests. The results are shown in the table. Assume that the two samples are independent
please help
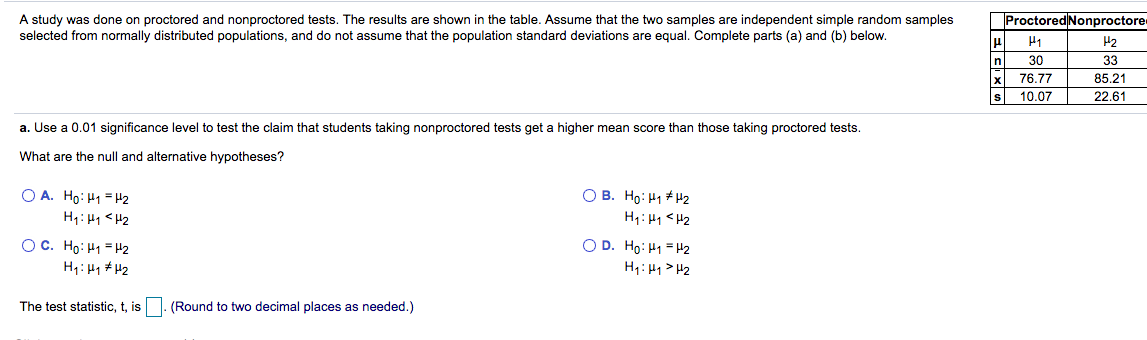
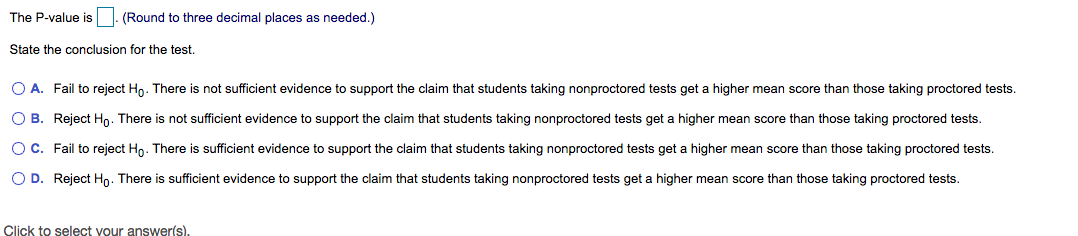
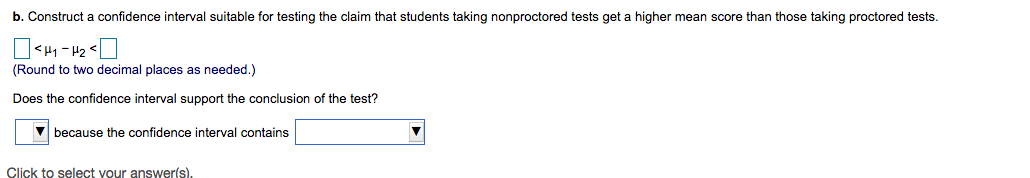
A study was done on proctored and nonproctored tests. The results are shown in the table. Assume that the two samples are independent simple random samples Proctored Nonproctore selected from normally distributed populations, and do not assume that the population standard deviations are equal. Complete parts (a) and (b) below. H1 H2 n 30 33 76.77 85.21 S 10.07 22.61 a. Use a 0.01 significance level to test the claim that students taking nonproctored tests get a higher mean score than those taking proctored tests. What are the null and alternative hypotheses? OA. Ho: H1 = H2 OB. Ho: H1 # H2 Hy : H1 =H2 Hy : H1 =H2 O C. Ho: H1 = H2 O D. Ho: H1 = H2 H1: H1 * H2 Hy : H1 > H2 The test statistic, t, is . (Round to two decimal places as needed.)The P-value is . (Round to three decimal places as needed.) State the conclusion for the test. O A. Fail to reject Ho. There is not sufficient evidence to support the claim that students taking nonproctored tests get a higher mean score than those taking proctored tests. O B. Reject Ho. There is not sufficient evidence to support the claim that students taking nonproctored tests get a higher mean score than those taking proctored tests. O C. Fail to reject Ho. There is sufficient evidence to support the claim that students taking nonproctored tests get a higher mean score than those taking proctored tests. O D. Reject Ho. There is sufficient evidence to support the claim that students taking nonproctored tests get a higher mean score than those taking proctored tests. Click to select vour answer(s).b. Construct a confidence interval suitable for testing the claim that students taking nonproctored tests get a higher mean score than those taking proctored tests.
Step by Step Solution
There are 3 Steps involved in it

Get step-by-step solutions from verified subject matter experts