

Question: please help all 3 pics are the same problem The following table contains the measurements of the key length dimension from a fuel injector. These
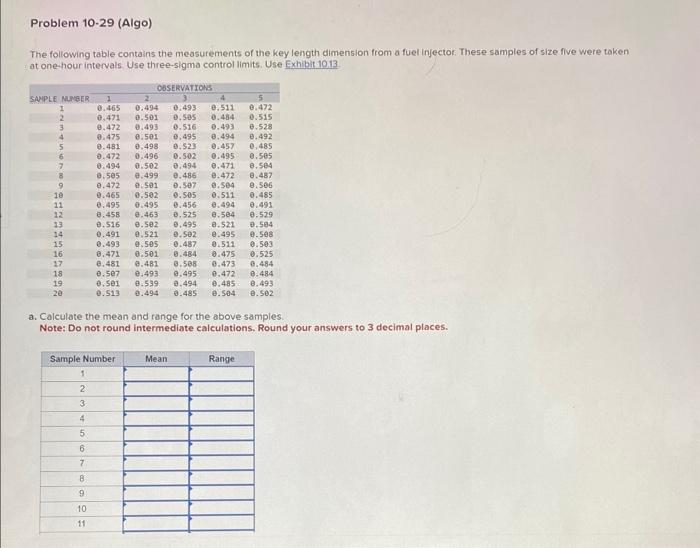
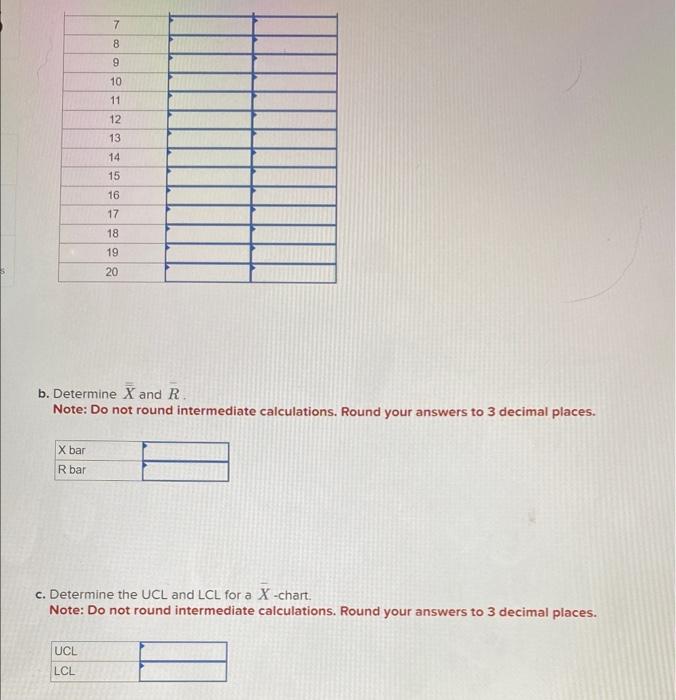
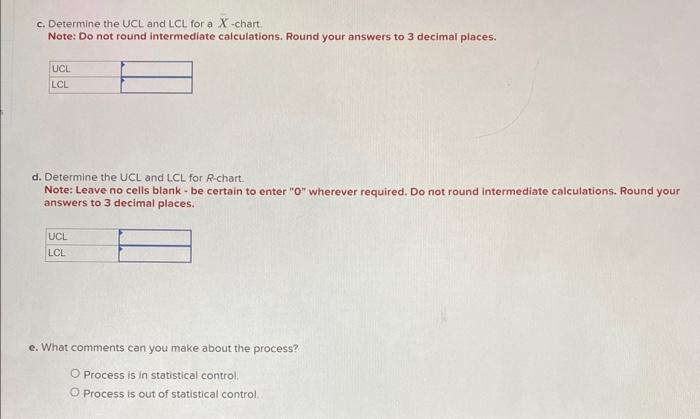
The following table contains the measurements of the key length dimension from a fuel injector. These samples of size five were taken at one-hour intervals. Use three-sigma control limits. Use Exhibit 10.13 a. Calculate the mean and range for the above samples. Note: Do not round intermediate calculations. Round your answers to 3 decimal places. b. Determine X and R. Note: Do not round intermediate calculations. Round your answers to 3 decimal places. c. Determine the UCL and LCL for a X-chart. Note: Do not round intermediate calculations. Round your answers to 3 decimal places. c. Determine the UCL and LCL for a X-chart Note: Do not round intermediate calculations. Round your answers to 3 decimal places. d. Determine the UCL and LCL for R-chart. Note: Leave no cells blank - be certain to enter "O" wherever required. Do not round intermediate calculations. Round your answers to 3 decimal places. e. What comments can you make about the process? Process is in statistical control. Process is out of statistical control
Step by Step Solution
There are 3 Steps involved in it

Get step-by-step solutions from verified subject matter experts