

Question: please help all information is here answer on excel , choose which company you'd like to do it for Select one company which reported earnings
 please help all information is here answer on excel , choose which company you'd like to do it for
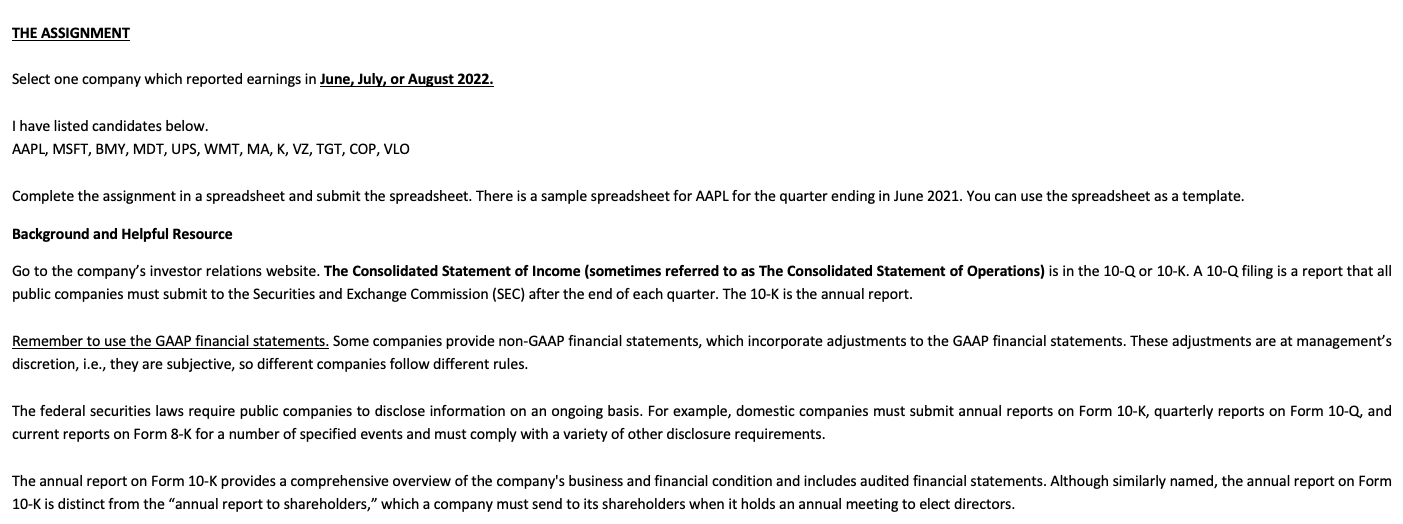
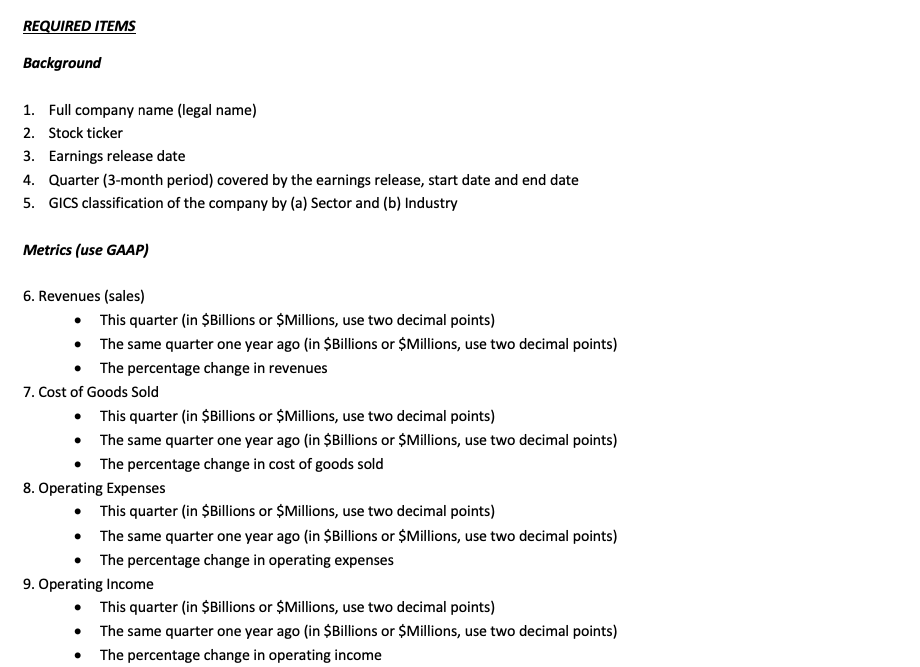
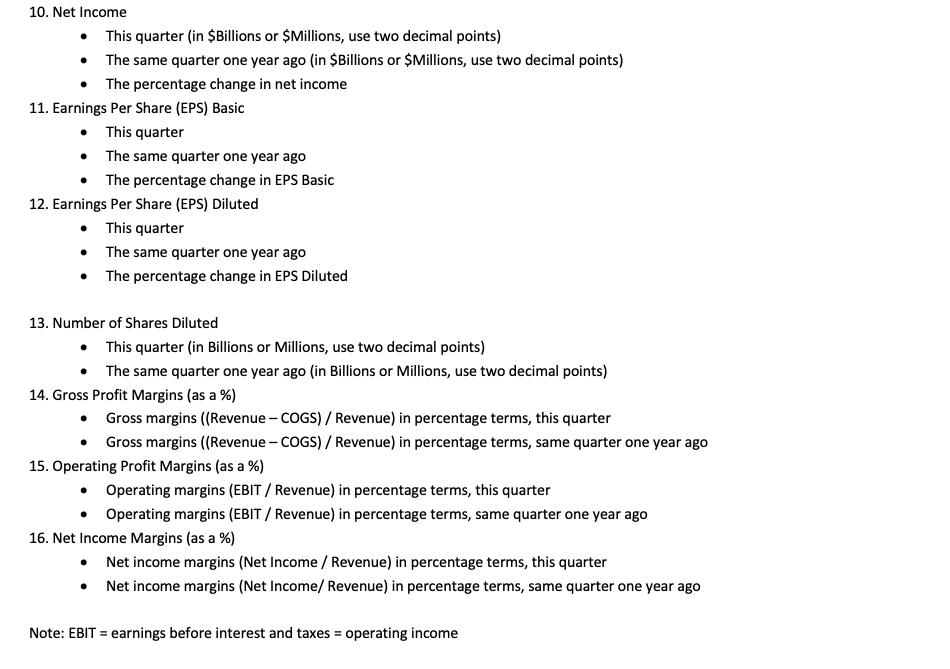
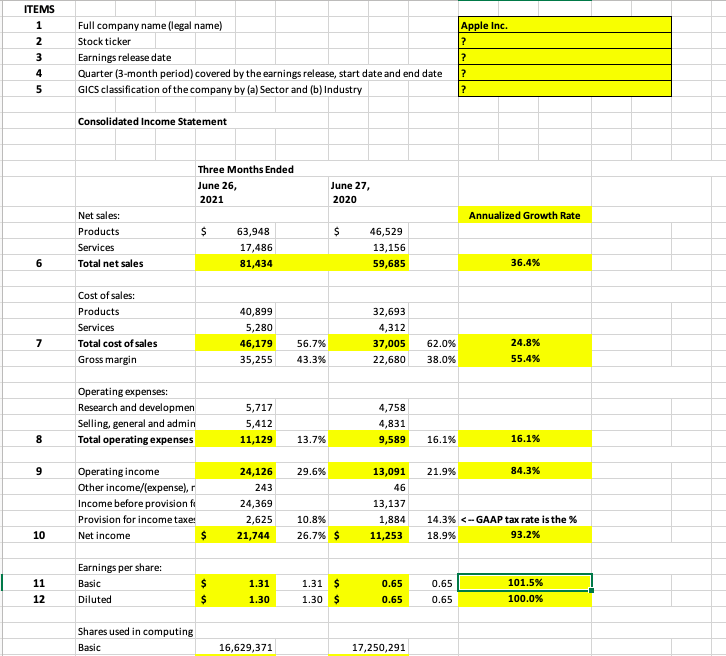
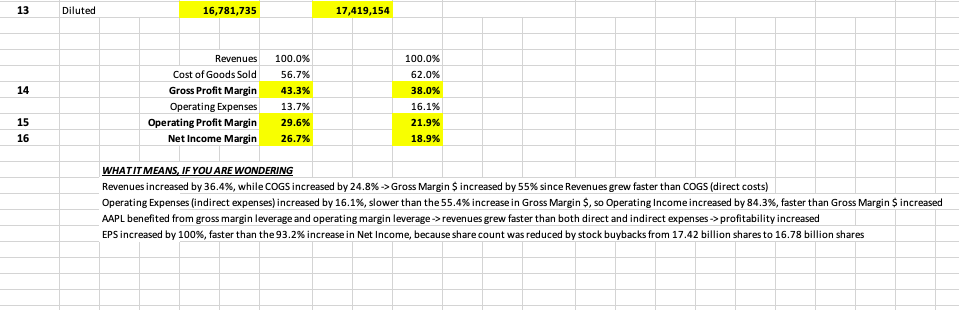
Select one company which reported earnings in June, July, or August 2022. I have listed candidates below. AAPL, MSFT, BMY, MDT, UPS, WMT, MA, K, VZ, TGT, COP, VLO Background and Helpful Resource public companies must submit to the Securities and Exchange Commission (SEC) after the end of each quarter. The 10-K is the annual report. discretion, i.e., they are subjective, so different companies follow different rules. current reports on Form 8-K for a number of specified events and must comply with a variety of other disclosure requirements. 10K is distinct from the "annual report to shareholders," which a company must send to its shareholders when it holds an annual meeting to elect directors. Background 1. Full company name (legal name) 2. Stock ticker 3. Earnings release date 4. Quarter (3-month period) covered by the earnings release, start date and end date 5. GICS classification of the company by (a) Sector and (b) Industry Metrics (use GAAP) 6. Revenues (sales) - This quarter (in \$Billions or \$Millions, use two decimal points) - The same quarter one year ago (in \$Billions or \$Millions, use two decimal points) - The percentage change in revenues 7. Cost of Goods Sold - This quarter (in \$Billions or \$Millions, use two decimal points) - The same quarter one year ago (in \$Billions or \$Millions, use two decimal points) - The percentage change in cost of goods sold 8. Operating Expenses - This quarter (in \$Billions or \$Millions, use two decimal points) - The same quarter one year ago (in \$Billions or \$Millions, use two decimal points) - The percentage change in operating expenses 9. Operating Income - This quarter (in \$Billions or \$Millions, use two decimal points) - The same quarter one year ago (in \$Billions or \$Millions, use two decimal points) - The percentage change in operating income 10. Net Income - This quarter (in \$Billions or \$Millions, use two decimal points) - The same quarter one year ago (in \$Billions or \$Millions, use two decimal points) - The percentage change in net income 11. Earnings Per Share (EPS) Basic - This quarter - The same quarter one year ago - The percentage change in EPS Basic 12. Earnings Per Share (EPS) Diluted - This quarter - The same quarter one year ago - The percentage change in EPS Diluted 13. Number of Shares Diluted - This quarter (in Billions or Millions, use two decimal points) - The same quarter one year ago (in Billions or Millions, use two decimal points) 14. Gross Profit Margins (as a \%) - Gross margins ((Revenue - COGS) / Revenue) in percentage terms, this quarter - Gross margins ((Revenue - COGS) / Revenue) in percentage terms, same quarter one year ago 15. Operating Profit Margins (as a \%) - Operating margins (EBIT / Revenue) in percentage terms, this quarter - Operating margins (EBIT / Revenue) in percentage terms, same quarter one year ago 16. Net Income Margins (as a \%) - Net income margins (Net Income / Revenue) in percentage terms, this quarter - Net income margins (Net Income/ Revenue) in percentage terms, same quarter one year ago \begin{tabular}{|l|l|l|l|} \hline ITEMS & & \\ \hline 1 & Full company name (legal name) & & Apple Inc. \\ \hline 2 & Stock ticker & ? \\ \hline 3 & Earnings release date & ? \\ \hline 4 & Quarter (3-month period) covered by the earnings release, start date and end date & ? \\ \hline 5 & GICS classification of the company by (a) Sector and (b) Industry & ? \\ \hline \end{tabular} Consolidated Income Statement \begin{tabular}{|r|r|r|r|r|r|} \hline 13 & Diluted & 16,781,735 & & 17,419,154 & \\ \hline & & & & & \\ \hline & & & & & \\ \hline & & & Revenues & 100.0% & \\ \hline & & Cost of Goods Sold & 56.7% & 100.0% \\ \hline 14 & & Gross Profit Margin & 43.3% & 62.0% \\ \hline & & Operating Expenses & 13.7% & 38.0% \\ \hline 15 & & Operating Profit Margin & 29.6% & 16.1% \\ \hline 16 & & Net Income Margin & 26.7% & 21.9% \\ \hline \end{tabular} WHATITMEANS, IF YOU ARE WONDERING Revenues increased by 36.4%, while COGS increased by 24.8%> Gross Margin $ increased by 55% since Revenues grew faster than COGS (direct costs) AAPL benefited from gross margin leverage and operating margin leverage > revenues grew faster than both direct and indirect expenses -> profitability increased EPS increased by 100%, faster than the 93.2% increase in Net Income, because share count was reduced by stock buybacks from 17.42 billion shares to 16.78 billion shares Select one company which reported earnings in June, July, or August 2022. I have listed candidates below. AAPL, MSFT, BMY, MDT, UPS, WMT, MA, K, VZ, TGT, COP, VLO Background and Helpful Resource public companies must submit to the Securities and Exchange Commission (SEC) after the end of each quarter. The 10-K is the annual report. discretion, i.e., they are subjective, so different companies follow different rules. current reports on Form 8-K for a number of specified events and must comply with a variety of other disclosure requirements. 10K is distinct from the "annual report to shareholders," which a company must send to its shareholders when it holds an annual meeting to elect directors. Background 1. Full company name (legal name) 2. Stock ticker 3. Earnings release date 4. Quarter (3-month period) covered by the earnings release, start date and end date 5. GICS classification of the company by (a) Sector and (b) Industry Metrics (use GAAP) 6. Revenues (sales) - This quarter (in \$Billions or \$Millions, use two decimal points) - The same quarter one year ago (in \$Billions or \$Millions, use two decimal points) - The percentage change in revenues 7. Cost of Goods Sold - This quarter (in \$Billions or \$Millions, use two decimal points) - The same quarter one year ago (in \$Billions or \$Millions, use two decimal points) - The percentage change in cost of goods sold 8. Operating Expenses - This quarter (in \$Billions or \$Millions, use two decimal points) - The same quarter one year ago (in \$Billions or \$Millions, use two decimal points) - The percentage change in operating expenses 9. Operating Income - This quarter (in \$Billions or \$Millions, use two decimal points) - The same quarter one year ago (in \$Billions or \$Millions, use two decimal points) - The percentage change in operating income 10. Net Income - This quarter (in \$Billions or \$Millions, use two decimal points) - The same quarter one year ago (in \$Billions or \$Millions, use two decimal points) - The percentage change in net income 11. Earnings Per Share (EPS) Basic - This quarter - The same quarter one year ago - The percentage change in EPS Basic 12. Earnings Per Share (EPS) Diluted - This quarter - The same quarter one year ago - The percentage change in EPS Diluted 13. Number of Shares Diluted - This quarter (in Billions or Millions, use two decimal points) - The same quarter one year ago (in Billions or Millions, use two decimal points) 14. Gross Profit Margins (as a \%) - Gross margins ((Revenue - COGS) / Revenue) in percentage terms, this quarter - Gross margins ((Revenue - COGS) / Revenue) in percentage terms, same quarter one year ago 15. Operating Profit Margins (as a \%) - Operating margins (EBIT / Revenue) in percentage terms, this quarter - Operating margins (EBIT / Revenue) in percentage terms, same quarter one year ago 16. Net Income Margins (as a \%) - Net income margins (Net Income / Revenue) in percentage terms, this quarter - Net income margins (Net Income/ Revenue) in percentage terms, same quarter one year ago \begin{tabular}{|l|l|l|l|} \hline ITEMS & & \\ \hline 1 & Full company name (legal name) & & Apple Inc. \\ \hline 2 & Stock ticker & ? \\ \hline 3 & Earnings release date & ? \\ \hline 4 & Quarter (3-month period) covered by the earnings release, start date and end date & ? \\ \hline 5 & GICS classification of the company by (a) Sector and (b) Industry & ? \\ \hline \end{tabular} Consolidated Income Statement \begin{tabular}{|r|r|r|r|r|r|} \hline 13 & Diluted & 16,781,735 & & 17,419,154 & \\ \hline & & & & & \\ \hline & & & & & \\ \hline & & & Revenues & 100.0% & \\ \hline & & Cost of Goods Sold & 56.7% & 100.0% \\ \hline 14 & & Gross Profit Margin & 43.3% & 62.0% \\ \hline & & Operating Expenses & 13.7% & 38.0% \\ \hline 15 & & Operating Profit Margin & 29.6% & 16.1% \\ \hline 16 & & Net Income Margin & 26.7% & 21.9% \\ \hline \end{tabular} WHATITMEANS, IF YOU ARE WONDERING Revenues increased by 36.4%, while COGS increased by 24.8%> Gross Margin $ increased by 55% since Revenues grew faster than COGS (direct costs) AAPL benefited from gross margin leverage and operating margin leverage > revenues grew faster than both direct and indirect expenses -> profitability increased EPS increased by 100%, faster than the 93.2% increase in Net Income, because share count was reduced by stock buybacks from 17.42 billion shares to 16.78 billion shares
Step by Step Solution
There are 3 Steps involved in it

Get step-by-step solutions from verified subject matter experts