

Question: please help An article reported the following frequencies with which ethnic characters appeared in recorded commercials that aired on Philadelphia television stations. Ethnicity: African American
please help
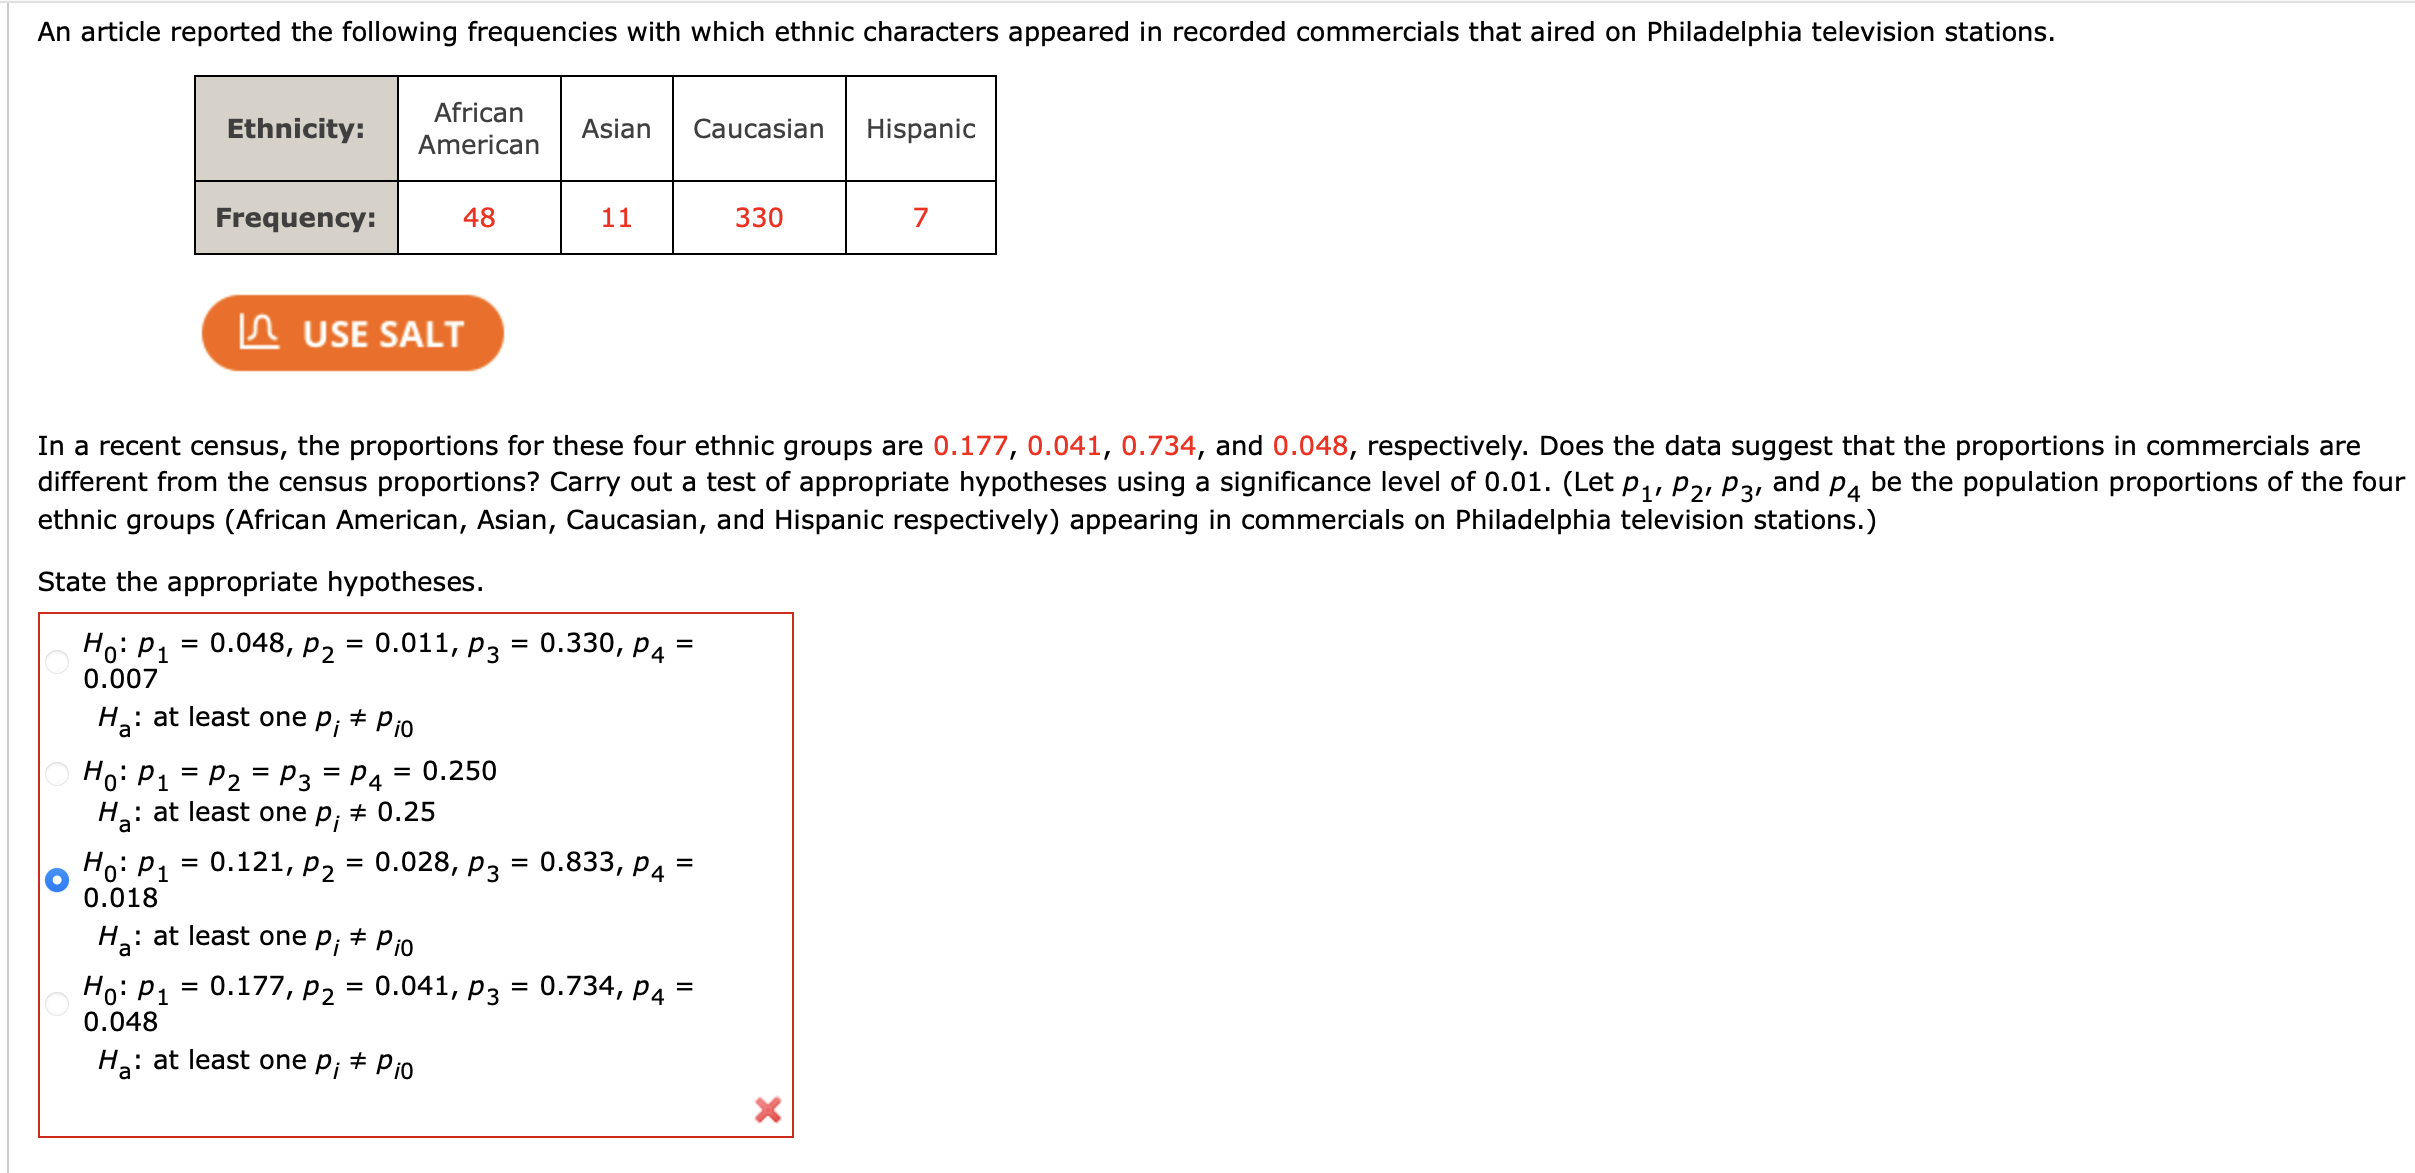
An article reported the following frequencies with which ethnic characters appeared in recorded commercials that aired on Philadelphia television stations. Ethnicity: African American Asian Caucasian Hispanic Frequency: 48 11 330 7 LA USE SALT In a recent census, the proportions for these four ethnic groups are 0.177, 0.041, 0.734, and 0.048, respectively. Does the data suggest that the proportions in commercials are different from the census proportions? Carry out a test of appropriate hypotheses using a significance level of 0.01. (Let P1 , P2, P3, and p be the population proportions of the four ethnic groups (African American, Asian, Caucasian, and Hispanic respectively) appearing in commercials on Philadelphia television stations.) State the appropriate hypotheses. Ho: P1 = 0.048, P2 = 0.011, P3 = 0.330, P4 = 0.007 Ha: at least one p; # Pio Ho: P1 = P2 = P3 = P4 = 0.250 H: at least one p; # 0.25 O Ho: P1 = 0.121, P2 = 0.028, P3 = 0.833, P4 = 0.018 Ha: at least one p; # Pio Ho: P1 = 0.177, P2 = 0.041, P3 = 0.734, P4 = 0.048 Ha: at least one p; # Pio X
Step by Step Solution
There are 3 Steps involved in it

Get step-by-step solutions from verified subject matter experts