

Question: Please help analyze and explain each chart. Percent State Percent Legislature Public Pro- Dem, 2013 choice Percent State Pearson 620 Legislature Dem, Correlation 2013 Sig.

Please help analyze and explain each chart.
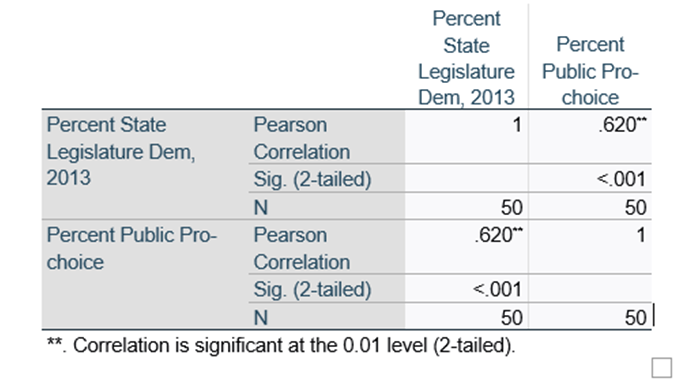
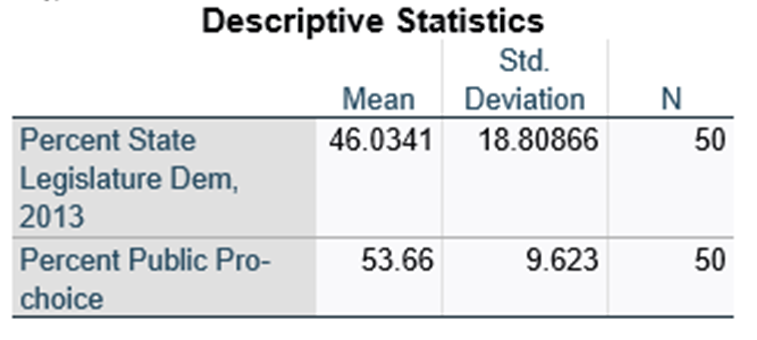
Percent State Percent Legislature Public Pro- Dem, 2013 choice Percent State Pearson 620" Legislature Dem, Correlation 2013 Sig. (2-tailed) <.001 n percent public pro- pearson .620 choice correlation sig. is significant at the level statistics std. mean deviation state legislature dem>
Step by Step Solution
There are 3 Steps involved in it
1 Expert Approved Answer
Step: 1 Unlock

Question Has Been Solved by an Expert!
Get step-by-step solutions from verified subject matter experts
Step: 2 Unlock
Step: 3 Unlock