

Question: Please help and explain Data was collected for 242 randomly selected 10 minute intervals. For each ten-minute interval, the number of people entering the atrium

Please help and explain
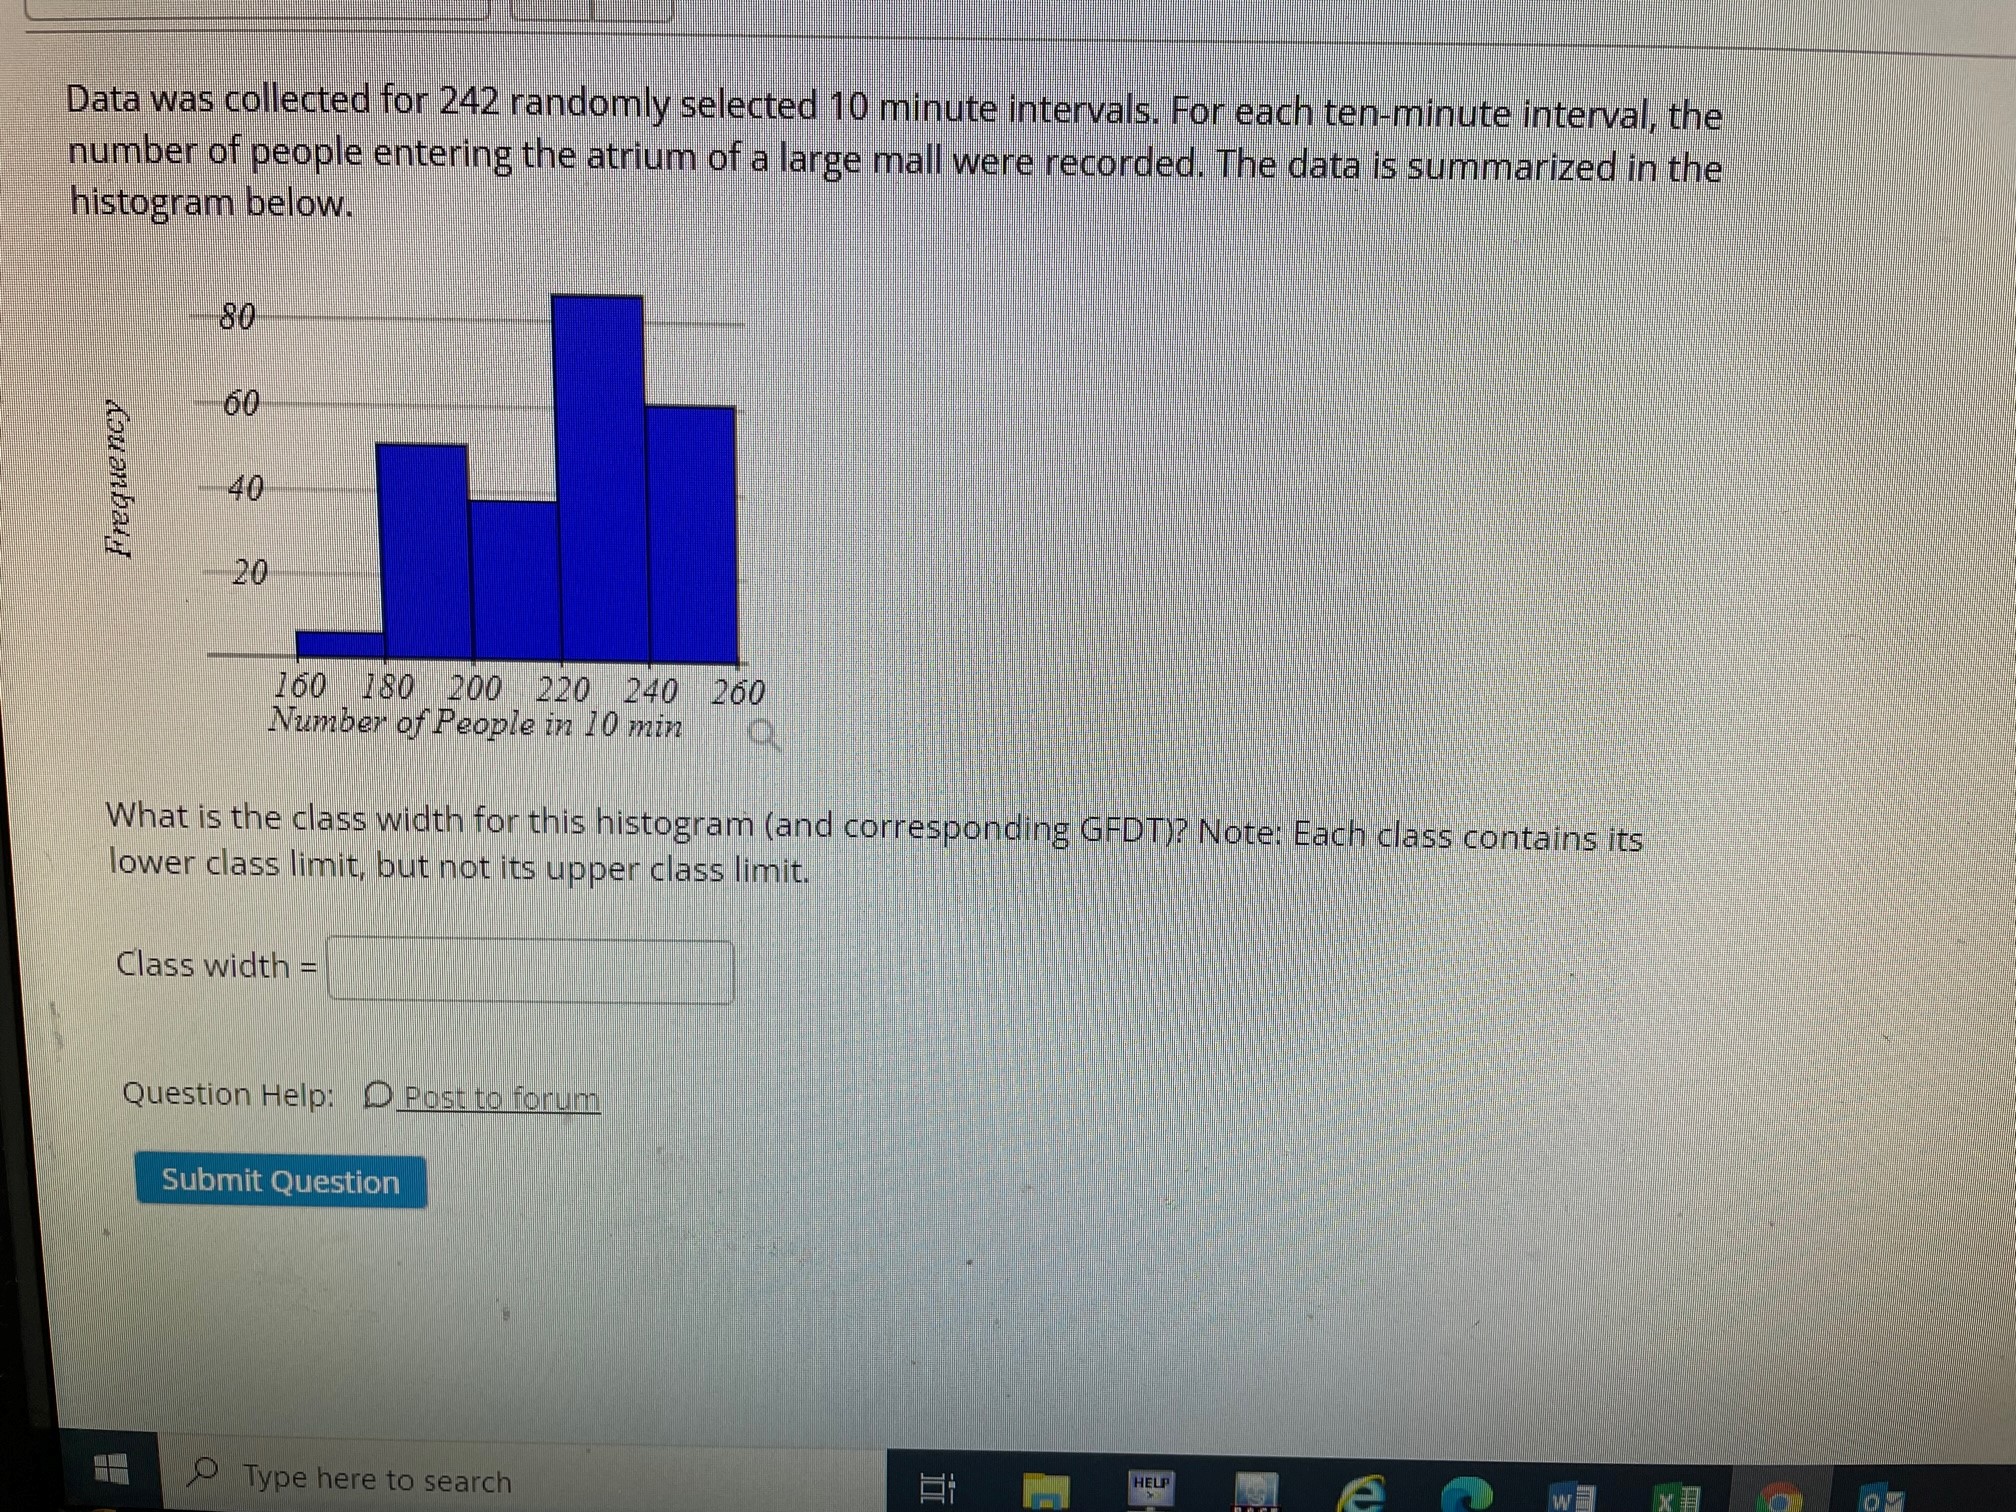
Data was collected for 242 randomly selected 10 minute intervals. For each ten-minute interval, the number of people entering the atrium of a large mall were recorded. The data is summarized in the histogram below. 80 60 Frequency 40 20 160 180 200 220 240 260 Number of People in 10 min What is the class width for this histogram (and corresponding GFDT)? Note: Each class contains its lower class limit, but not its upper class limit. Class width = Question Help: D Post to forum Submit Question Type here to search HELP
Step by Step Solution
There are 3 Steps involved in it
1 Expert Approved Answer
Step: 1 Unlock

Question Has Been Solved by an Expert!
Get step-by-step solutions from verified subject matter experts
Step: 2 Unlock
Step: 3 Unlock