

Question: please help and explain!!! Scenario 3 - Excel Based Use the scenario described below to answer the following questions. You are performing Economics research and
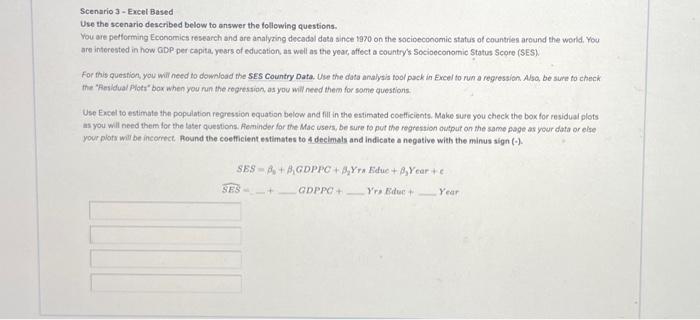
Scenario 3 - Excel Based Use the scenario described below to answer the following questions. You are performing Economics research and are analyzing decadal data since 1970 on the socipeconomic status of countries around the worla. You are interested in how GDP per capita, years of education as well as the yoac, affect a country's Socioeconomic Status Score (SES). For this question, you will need to download the SES Country Data. Use the dota analysis tool puck in Excel to run a regression Alsa, be sure to check the "Residual Plotr" box when you fun the cogression, as you will need them for some guestions Use Ercel to estimate the population regression equation below and fir in the estimated coefficients. Make sure you check the box for residual plots is you will need them for the tater questions. Aeminder for the Mac users, be sure to put the regrestion output an the same page as your data or else your plotr witr be inconect. nound the coefficient estimates to 4 declmals and indicate a negative with the minus sign (). SBS=0+1GDPPC+2YrnEduc+3Ycar+c SES=+ CDPPC+ Yro Edae * Year
Step by Step Solution
There are 3 Steps involved in it

Get step-by-step solutions from verified subject matter experts