

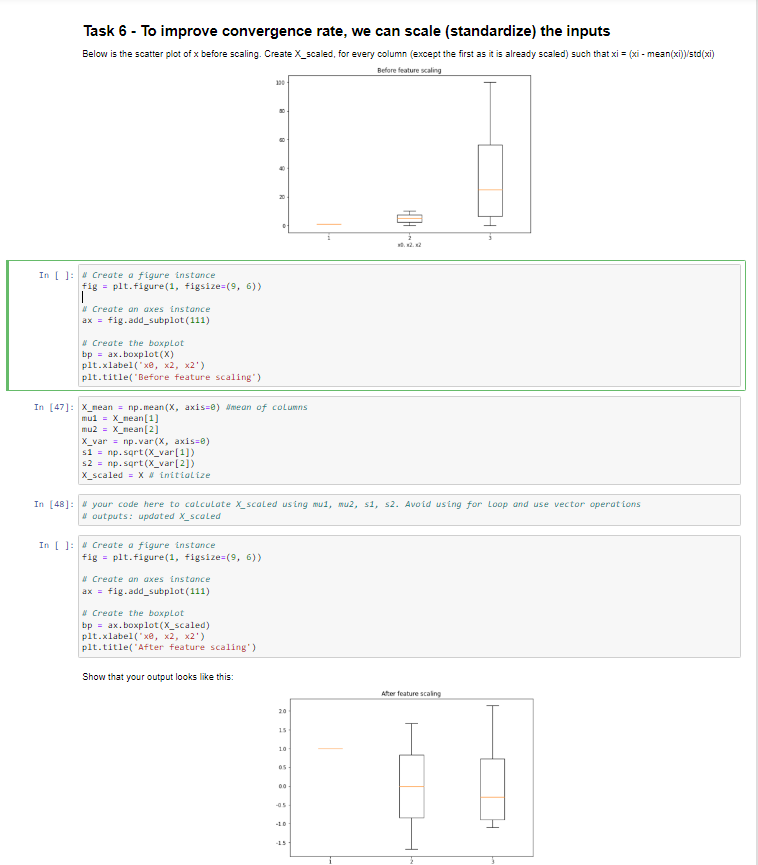
Question: Please Help and explain, Task 6 - To improve convergence rate, we can scale ( standardize ) the inputs Below is the scatter plot of
Please Help and explain,
Task To improve convergence rate, we can scale standardize the inputs
Below is the scatter plot of before scaling. Create Xscaled, for every column except the first as it is already scaled such that
In : $ Create a figure instance
fig pit.figure figsize
Create an axes instance
fig.addsubplot
Create the boxplot
ptxlabelxe x x
plttitleBefore feature scaling"
In
npmean axis wimean of columns
mu
munean
var npvar axis
s npsqrt Xvar
npsqrt Xvar
xscaled intialize
In : & your code here to calculate Xscaled using mu wu s s Avoid using for loop and use vector operations
outputs: updated scaled
In : $ Create a figure instance
fig pit.figure figsize
Create an axes instance
fig.addsubplot
A Create the boxplot
boxplot Xscaled
ptxlabelxe
plttitleAfter feature scaling'
Show that your output looks like this:Task To improve convergence rate, we can scale standardize the inputs
Below is the scatter plot of before scaling. Create Xscaled, for every column except the first as it is already scaled such that
In : $ Create a figure instance
fig pit.figure figsize
Create an axes instance
fig.addsubplot
Create the boxplot
ptxlabelxe x x
plttitleBefore feature scaling"
In
npmean axis wimean of columns
mu
munean
var npvar axis
s npsqrt Xvar
npsqrt Xvar
xscaled intialize
In : & your code here to calculate Xscaled using mu wu s s Avoid using for loop and use vector operations
outputs: updated scaled
In : $ Create a figure instance
fig pit.figure figsize
Create an axes instance
fig.addsubplot
A Create the boxplot
boxplot Xscaled
ptxlabelxe
plttitleAfter feature scaling'
Show that your output looks like this:
Step by Step Solution
There are 3 Steps involved in it
1 Expert Approved Answer
Step: 1 Unlock

Question Has Been Solved by an Expert!
Get step-by-step solutions from verified subject matter experts
Step: 2 Unlock
Step: 3 Unlock