

Question: Please help and explain Which values should you plot to show a linear relationship? fear Jlation Log(population) 0 2000 3.301 5000 3.699 W N 8000
Please help and explain
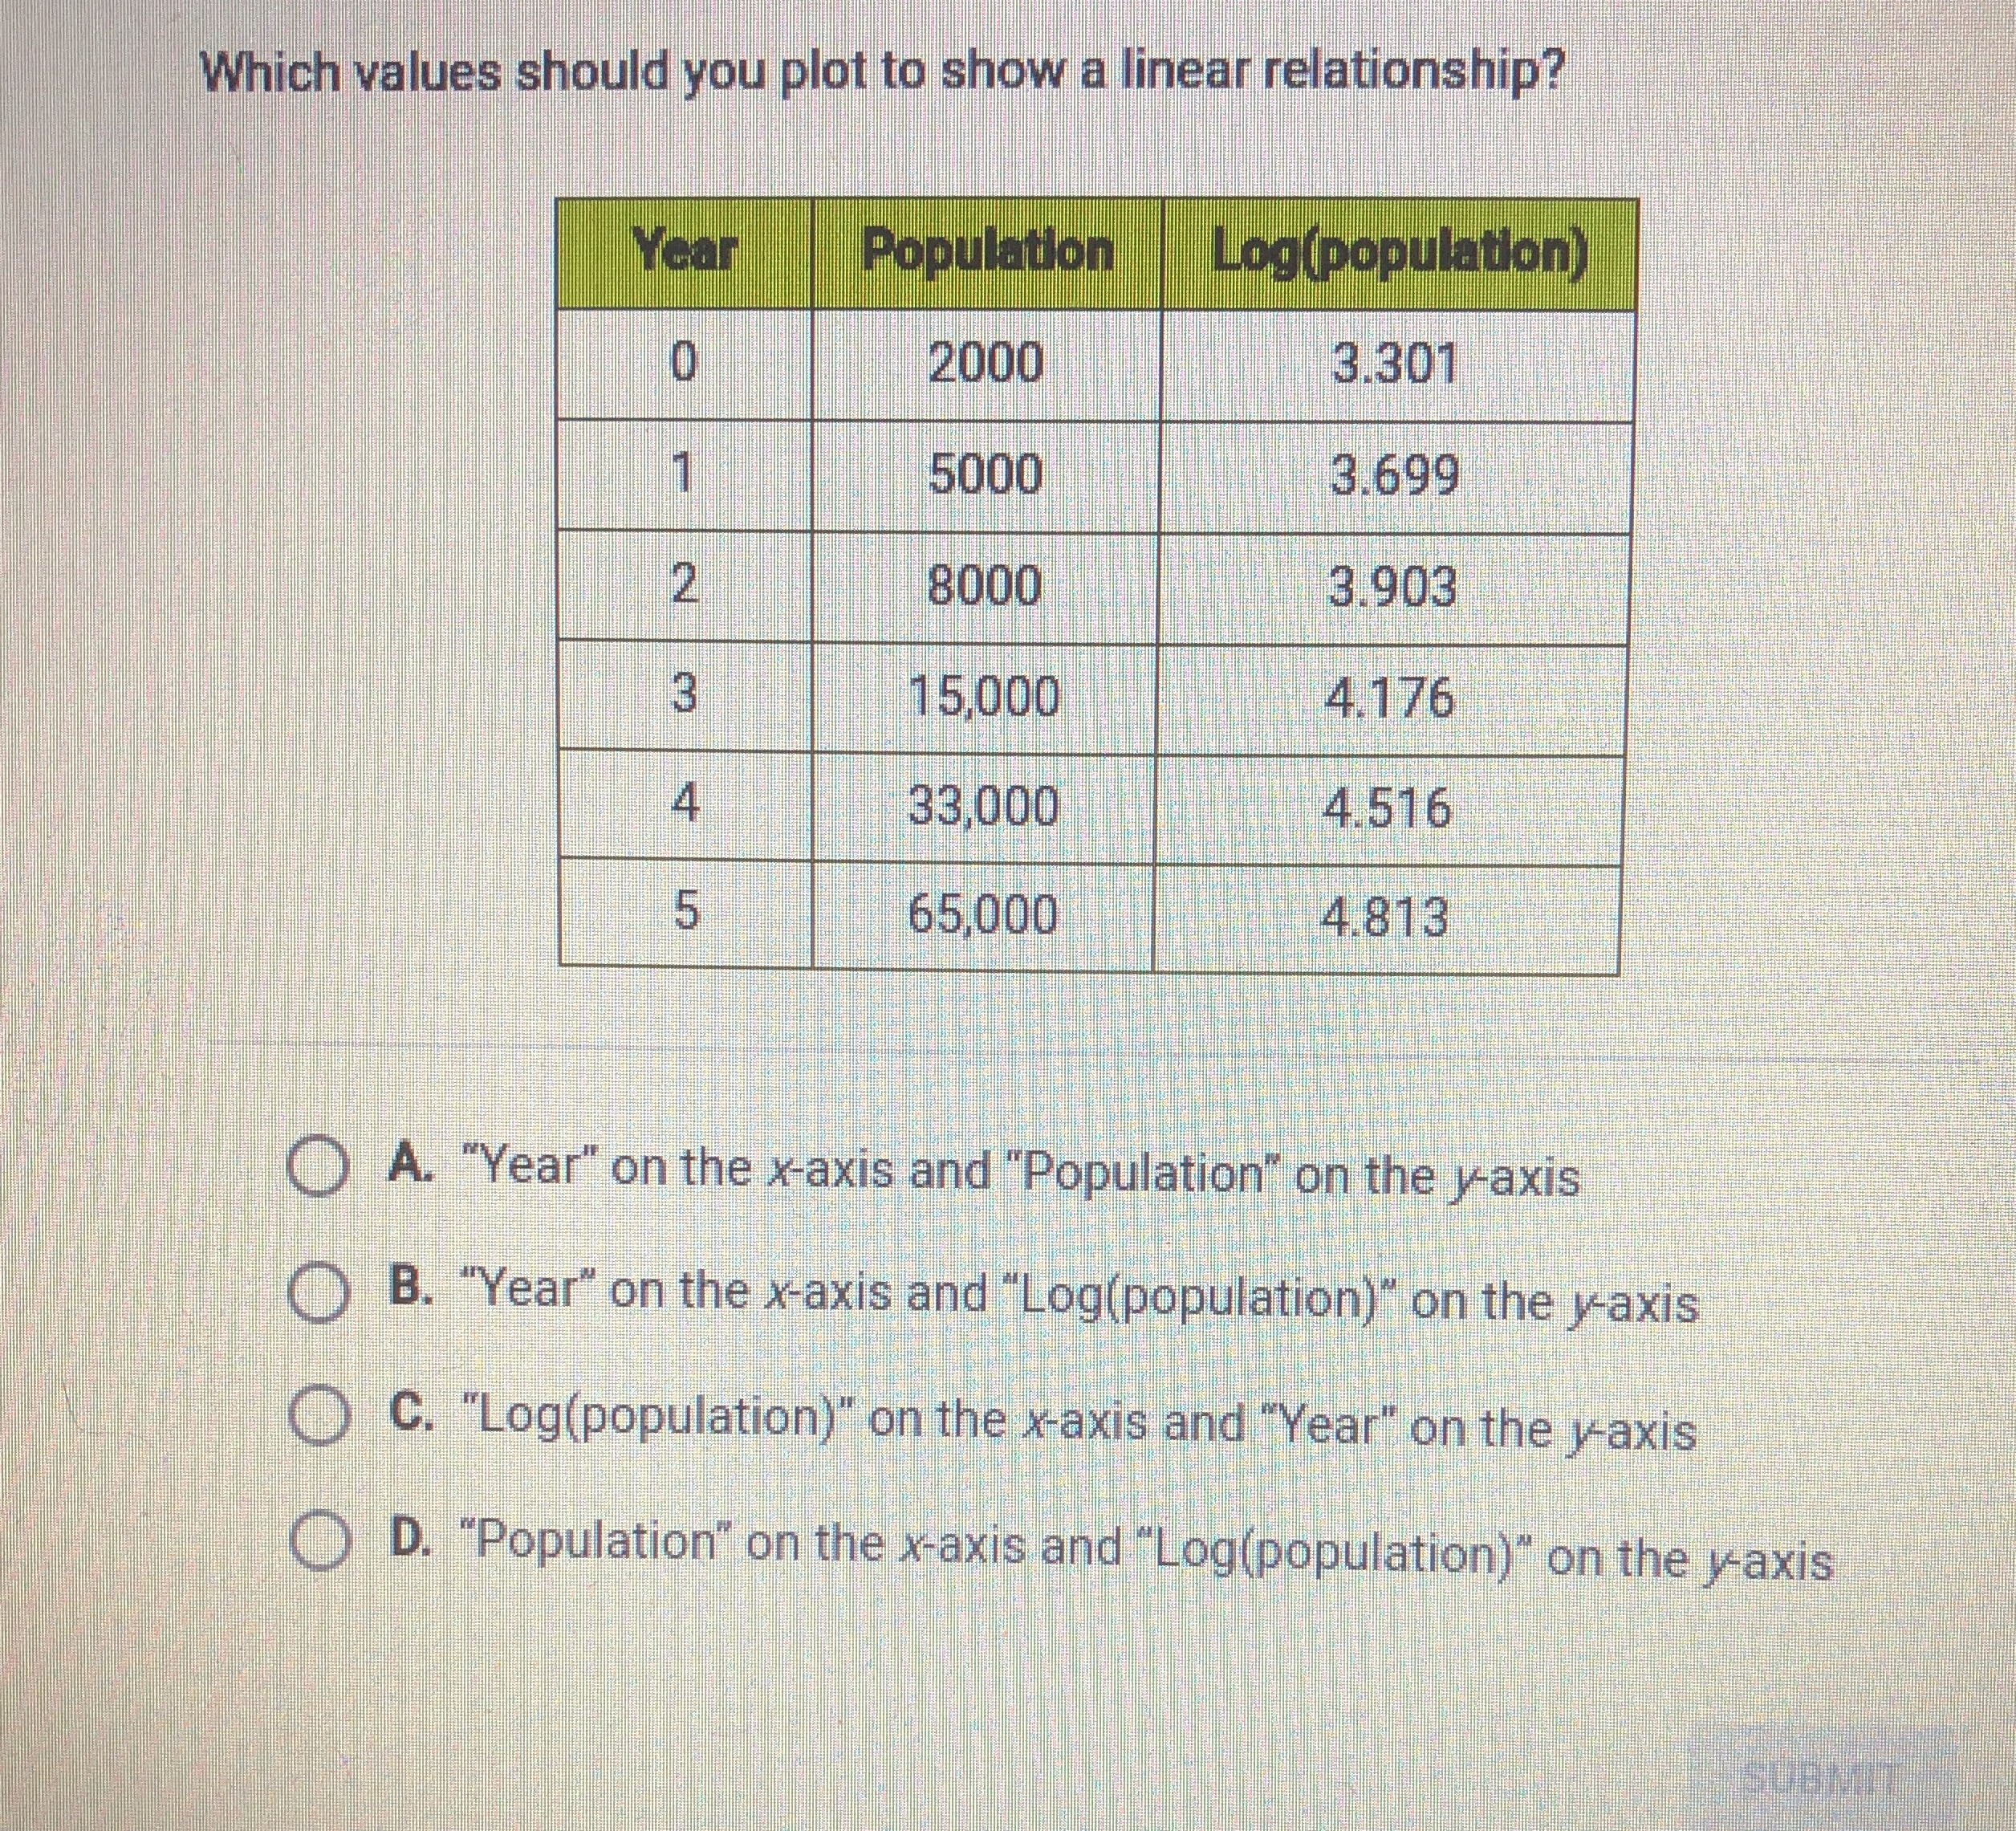
Which values should you plot to show a linear relationship? fear Jlation Log(population) 0 2000 3.301 5000 3.699 W N 8000 3.903 15,000 4.176 33,000 4.516 5 65,000 4.813 A. "Year" on the x-axis and "Population" on the y-axis B. "Year" on the x-axis and "Log(population)" on the y-axis C. "Log(population)" on the x-axis and "Year" on the y-axis D. "Population" on the x-axis and "Log(population)" on the y-axis
Step by Step Solution
There are 3 Steps involved in it
1 Expert Approved Answer
Step: 1 Unlock

Question Has Been Solved by an Expert!
Get step-by-step solutions from verified subject matter experts
Step: 2 Unlock
Step: 3 Unlock