

Question: PLEASE HELP AND SHOW EXCEL EQUATION Use the financial data provided below to perform the following pieces of analysis: 1. a 2022 forecast of the
PLEASE HELP AND SHOW EXCEL EQUATION
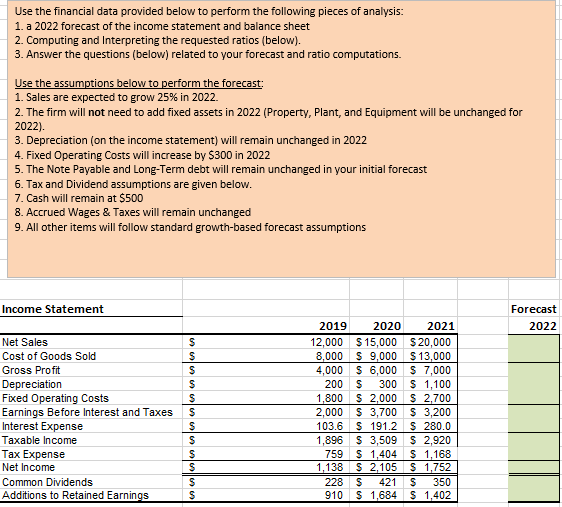
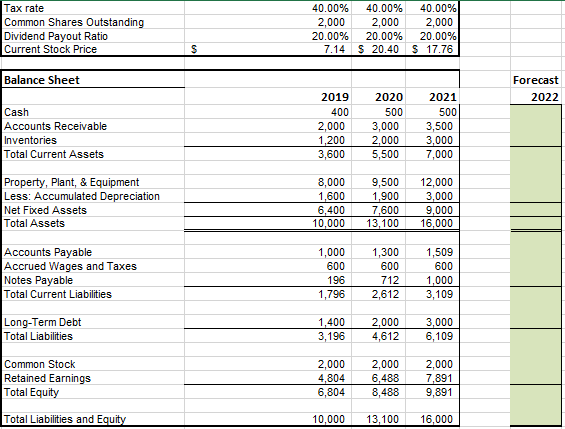
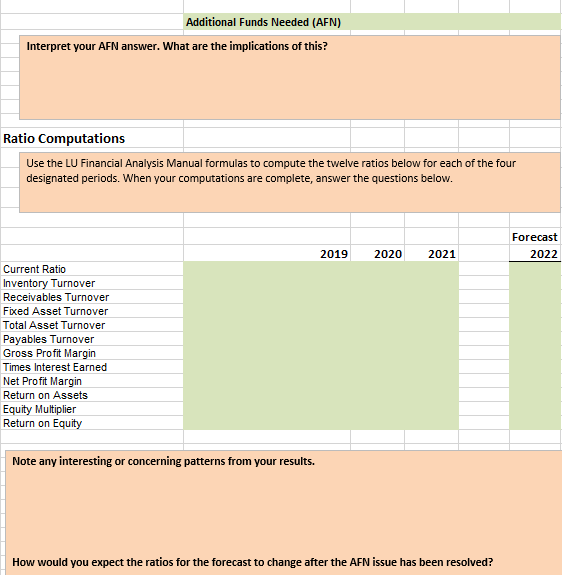
Use the financial data provided below to perform the following pieces of analysis: 1. a 2022 forecast of the income statement and balance sheet 2. Computing and Interpreting the requested ratios (below). 3. Answer the questions (below) related to your forecast and ratio computations. Use the assumptions below to perform the forecast: 1. Sales are expected to grow 25% in 2022. 2. The firm will not need to add fixed assets in 2022 (Property, Plant, and Equipment will be unchanged for 2022). 3. Depreciation (on the income statement) will remain unchanged in 2022 4. Fixed Operating costs will increase by $300 in 2022 5. The Note Payable and Long-Term debt will remain unchanged in your initial forecast 6. Tax and Dividend assumptions are given below. 7. Cash will remain at $500 8. Accrued Wages & Taxes will remain unchanged 9. All other items will follow standard growth-based forecast assumptions Income Statement Forecast 2022 Net Sales Cost of Goods Sold Gross Profit Depreciation Fixed Operating costs Earnings Before Interest and Taxes Interest Expense Taxable income Tax Expense Net Income Common Dividends Additions to Retained Earnings $ $ S s $ $ $ S 2019 2020 2021 12,000 $ 15,000 $20,000 8,000 S 9,000 $13,000 4,000 S 6,000 $ 7,000 200 $ 300 $ 1,100 1,800 $ 2.000 S 2,700 2,000 S 3,700 S 3,200 103.6 $ 191.2 S 280.0 1,896 $ 3,509 S 2,920 759 $ 1,404 S 1,168 1,138 $ 2,105 S 1,752 228 S 421 $ 350 910 S 1,684 S 1,402 S Tax rate Common Shares Outstanding Dividend Payout Ratio Current Stock Price 40.00% 40.00% 2,000 2,000 20.00% 20.00% 7.14 S 20.40 40.00% 2,000 20.00% $ 17.76 $ Balance Sheet Forecast 2022 Cash Accounts Receivable Inventories Total Current Assets 2019 400 2,000 1,200 3,600 2020 500 3,000 2,000 5,500 2021 500 3,500 3,000 7,000 Property, Plant, & Equipment Less: Accumulated Depreciation Net Fixed Assets Total Assets 8,000 1,600 6,400 10,000 9,500 1,900 7,600 13,100 12,000 3,000 9,000 16,000 Accounts Payable Accrued Wages and Taxes Notes Payable Total Current Liabilities Long-Term Debt Total Liabilities 1,000 600 196 1,796 1,300 600 712 2,612 1,509 600 1,000 3,109 1,400 3,196 2,000 4,612 3,000 6,109 Common Stock Retained Earnings Total Equity 2,000 4,804 6,804 2,000 6,488 8,488 2,000 7,891 9,891 Total Liabilities and Equity 10,000 13,100 16,000 Additional Funds Needed (AFN) Interpret your AFN answer. What are the implications of this? Ratio Computations Use the LU Financial Analysis Manual formulas to compute the twelve ratios below for each of the four designated periods. When your computations are complete, answer the questions below. Forecast 2022 2019 2020 2021 Current Ratio Inventory Turnover Receivables Turnover Fixed Asset Turnover Total Asset Turnover Payables Turnover Gross Profit Margin Times Interest Earned Net Profit Margin Return on Assets Equity Multiplier Return on Equity Note any interesting or concerning patterns from your results. How would you expect the ratios for the forecast to change after the AFN issue has been resolved? Use the financial data provided below to perform the following pieces of analysis: 1. a 2022 forecast of the income statement and balance sheet 2. Computing and Interpreting the requested ratios (below). 3. Answer the questions (below) related to your forecast and ratio computations. Use the assumptions below to perform the forecast: 1. Sales are expected to grow 25% in 2022. 2. The firm will not need to add fixed assets in 2022 (Property, Plant, and Equipment will be unchanged for 2022). 3. Depreciation (on the income statement) will remain unchanged in 2022 4. Fixed Operating costs will increase by $300 in 2022 5. The Note Payable and Long-Term debt will remain unchanged in your initial forecast 6. Tax and Dividend assumptions are given below. 7. Cash will remain at $500 8. Accrued Wages & Taxes will remain unchanged 9. All other items will follow standard growth-based forecast assumptions Income Statement Forecast 2022 Net Sales Cost of Goods Sold Gross Profit Depreciation Fixed Operating costs Earnings Before Interest and Taxes Interest Expense Taxable income Tax Expense Net Income Common Dividends Additions to Retained Earnings $ $ S s $ $ $ S 2019 2020 2021 12,000 $ 15,000 $20,000 8,000 S 9,000 $13,000 4,000 S 6,000 $ 7,000 200 $ 300 $ 1,100 1,800 $ 2.000 S 2,700 2,000 S 3,700 S 3,200 103.6 $ 191.2 S 280.0 1,896 $ 3,509 S 2,920 759 $ 1,404 S 1,168 1,138 $ 2,105 S 1,752 228 S 421 $ 350 910 S 1,684 S 1,402 S Tax rate Common Shares Outstanding Dividend Payout Ratio Current Stock Price 40.00% 40.00% 2,000 2,000 20.00% 20.00% 7.14 S 20.40 40.00% 2,000 20.00% $ 17.76 $ Balance Sheet Forecast 2022 Cash Accounts Receivable Inventories Total Current Assets 2019 400 2,000 1,200 3,600 2020 500 3,000 2,000 5,500 2021 500 3,500 3,000 7,000 Property, Plant, & Equipment Less: Accumulated Depreciation Net Fixed Assets Total Assets 8,000 1,600 6,400 10,000 9,500 1,900 7,600 13,100 12,000 3,000 9,000 16,000 Accounts Payable Accrued Wages and Taxes Notes Payable Total Current Liabilities Long-Term Debt Total Liabilities 1,000 600 196 1,796 1,300 600 712 2,612 1,509 600 1,000 3,109 1,400 3,196 2,000 4,612 3,000 6,109 Common Stock Retained Earnings Total Equity 2,000 4,804 6,804 2,000 6,488 8,488 2,000 7,891 9,891 Total Liabilities and Equity 10,000 13,100 16,000 Additional Funds Needed (AFN) Interpret your AFN answer. What are the implications of this? Ratio Computations Use the LU Financial Analysis Manual formulas to compute the twelve ratios below for each of the four designated periods. When your computations are complete, answer the questions below. Forecast 2022 2019 2020 2021 Current Ratio Inventory Turnover Receivables Turnover Fixed Asset Turnover Total Asset Turnover Payables Turnover Gross Profit Margin Times Interest Earned Net Profit Margin Return on Assets Equity Multiplier Return on Equity Note any interesting or concerning patterns from your results. How would you expect the ratios for the forecast to change after the AFN issue has been resolved
Step by Step Solution
There are 3 Steps involved in it

Get step-by-step solutions from verified subject matter experts