

Question: Please help answer study guide questions Supply Curve for Good R Price (dollars per unit) 100 S1 So 90 80 70 60 50 40 30
Please help answer study guide questions
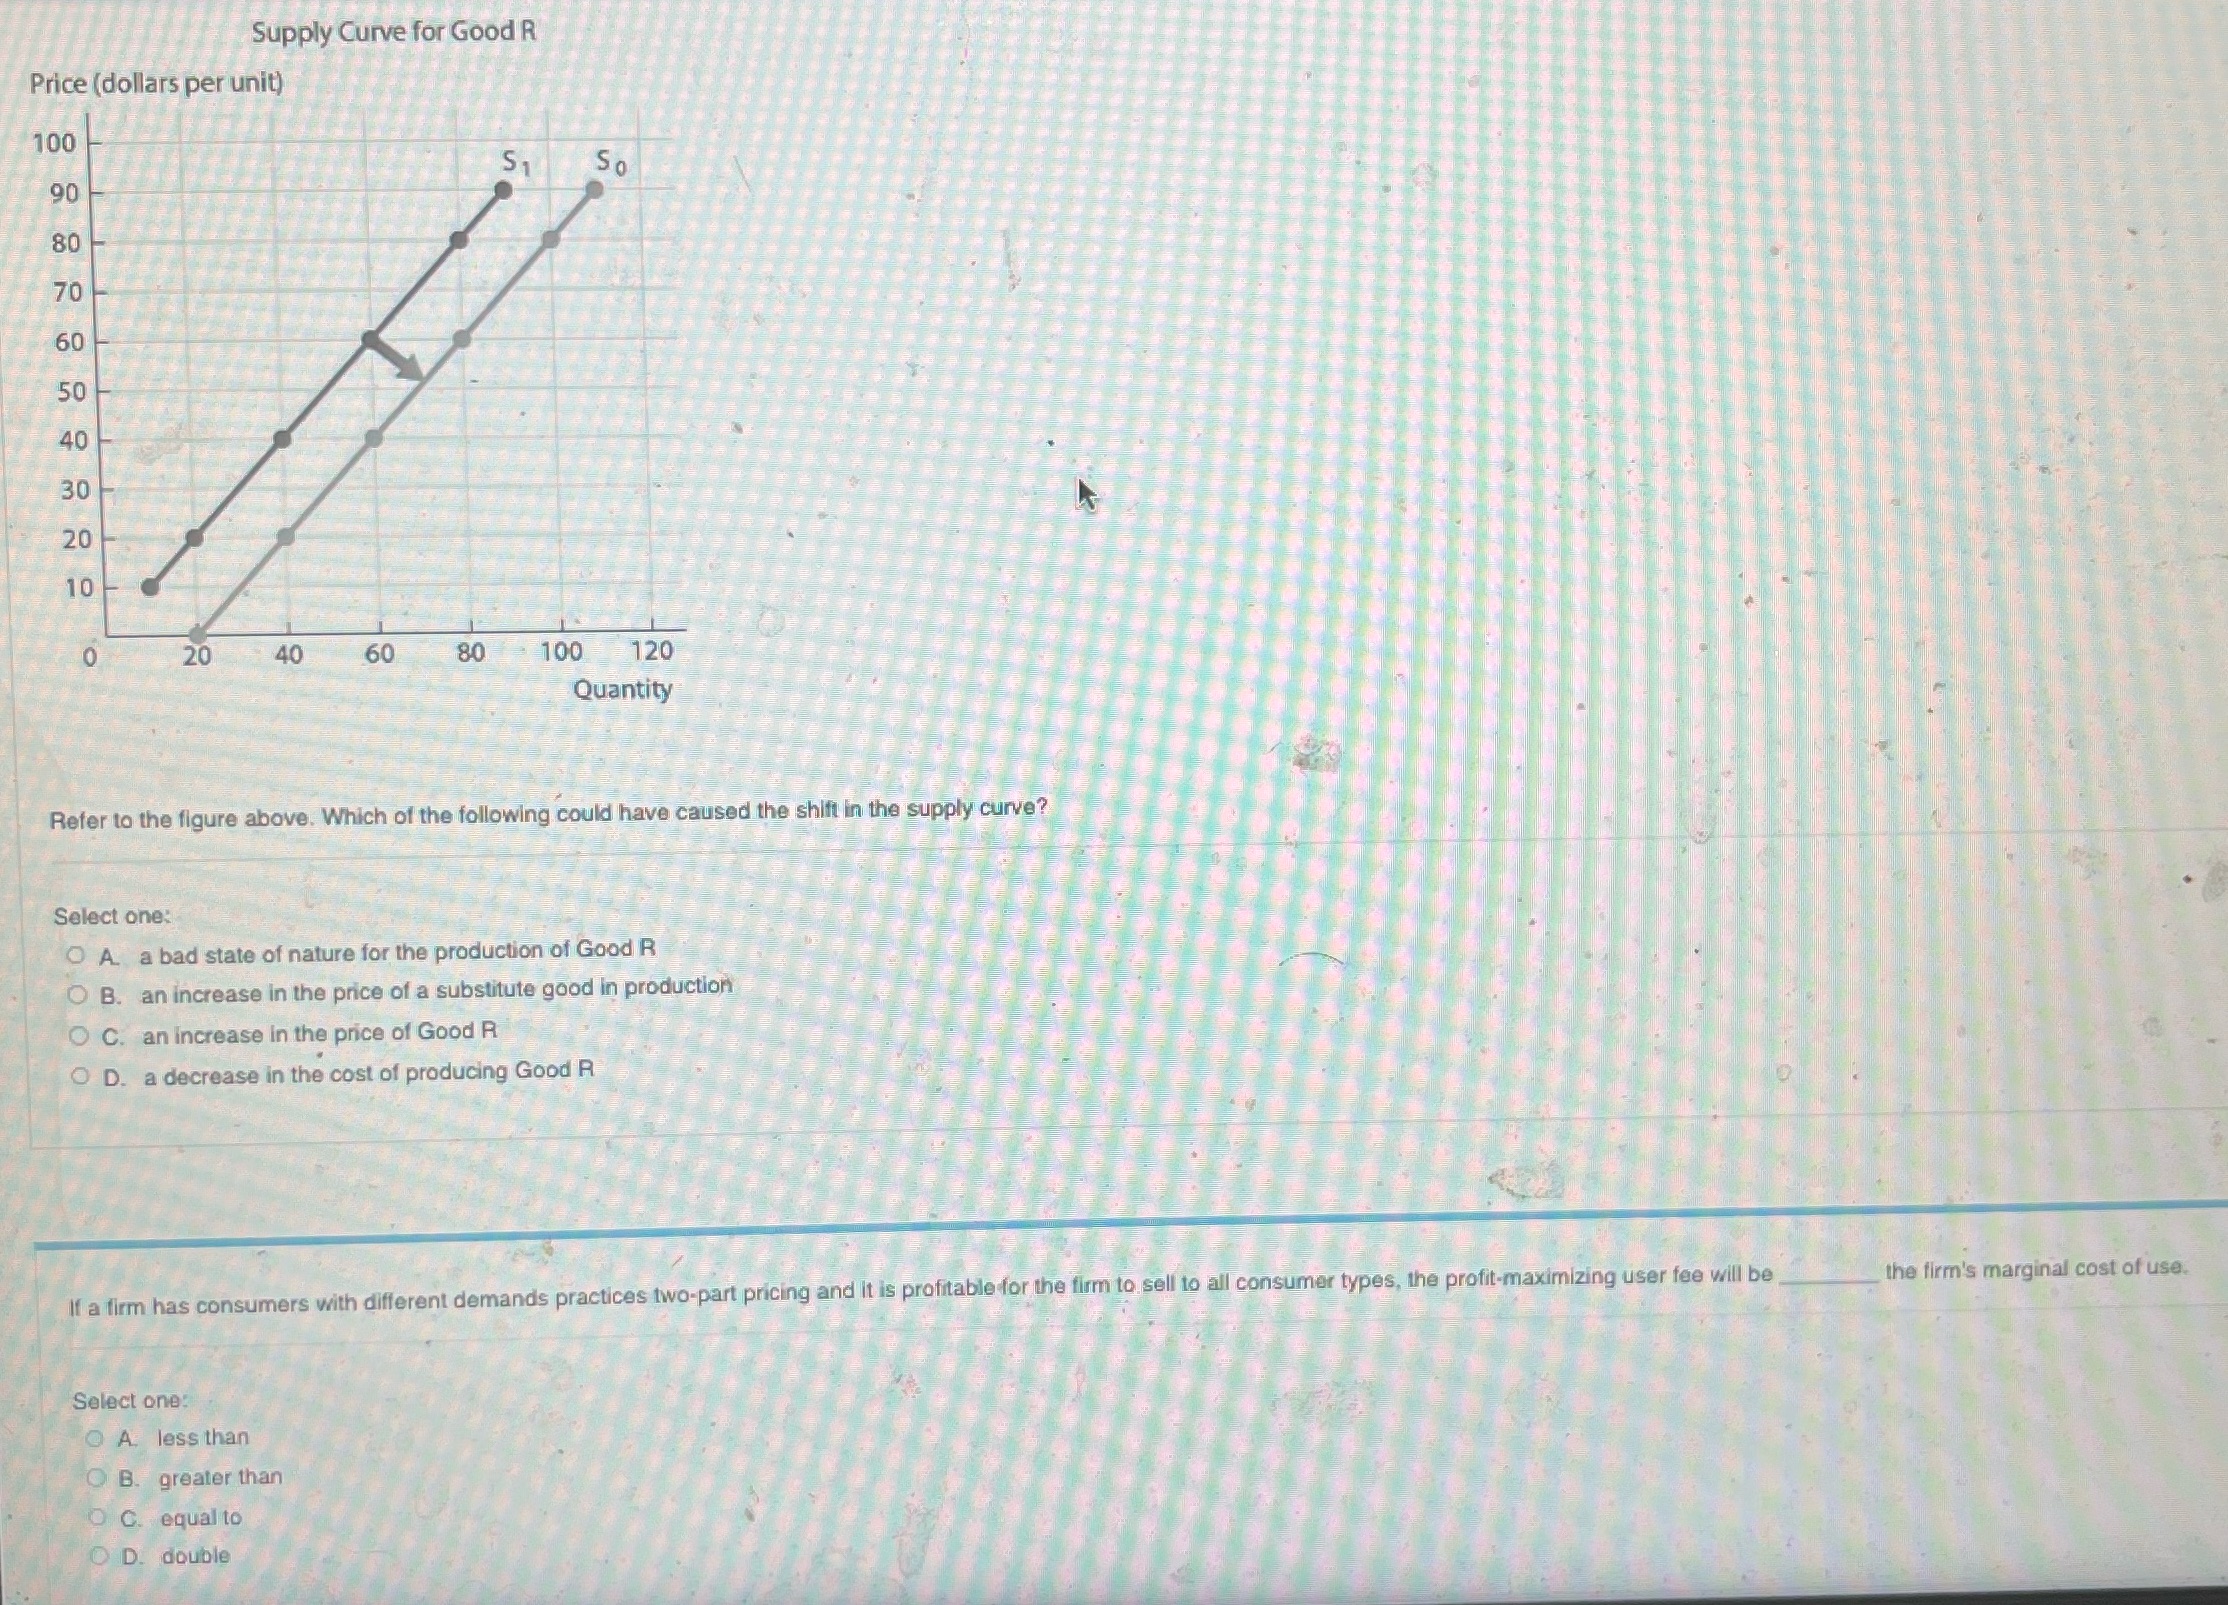
Supply Curve for Good R Price (dollars per unit) 100 S1 So 90 80 70 60 50 40 30 20 10 0 20 40 60 80 100 120 Quantity Refer to the figure above. Which of the following could have caused the shift in the supply curve? Select one: A. a bad state of nature for the production of Good R O B. an increase in the price of a substitute good in production C. an increase in the price of Good R O D. a decrease in the cost of producing Good R the firm's marginal cost of use. If a firm has consumers with different demands practices two-part pricing and it is profitable for the firm to sell to all consumer types, the profit-maximizing user fee will be Select one: O A less than O B. greater than O C. equal to O D. double
Step by Step Solution
There are 3 Steps involved in it

Get step-by-step solutions from verified subject matter experts