

Question: Please help answer the box The folowing graph shows the value of a stocok's divicends over tine. The stock's current d vidend is $1.00 per
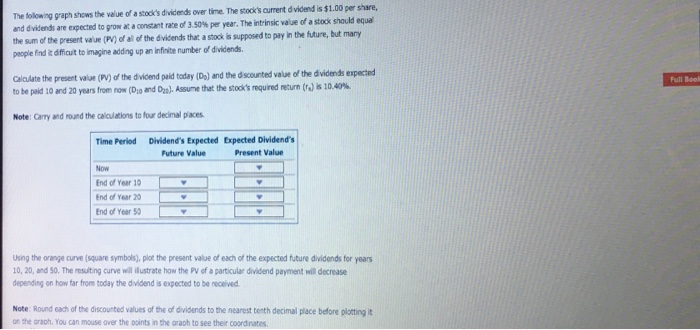
The folowing graph shows the value of a stocok's divicends over tine. The stock's current d vidend is $1.00 per share, ddvidends are expened to pow at a constant rate of 3.50% per year. The intrinsic vale of a stock should equal the sum of the present va'ue (Pv) of all of the dividends that a stock is supposed to pay in the future, but many paople find ik diffcut to imagine adding up an infinite number of dividends alculate the present value (PV) of the dviend paid today (Db) and the discounted vale of the dividends espected tobe paid 10 and 20 years from now (Dio and Das). Assure that the stock's required return (r.) is 10.40%. Full Book Note: Carry and round the calculations to four decimal paces. Dividend's Expected Future Value Expected Dividend's Present Value Time Period Now End of Year 10 nd of Year 20 End of Year 5 Using the orange curve (square symbols), plot the present value of each of the expected future dividends for years 10, 20, and So. The resulting curve will ilustrate how the PV of a particular dividend payment wil decrease depending on how far from today the dividend is expected to be neceived Note: Round each of the discounted values of the of dividends to the nearest tenth decimal place before plotting it on the araoh. You can mouse over the ooints in the araph to see their
Step by Step Solution
There are 3 Steps involved in it

Get step-by-step solutions from verified subject matter experts