

Question: Please help answer the following: Student ID Sophomores Juniors 1 3.04 2.56 1.71 2.77 3.3 2.7 2.88 3 2.11 2.98 6 2.6 3.47 2.92 3.26
Please help answer the following:
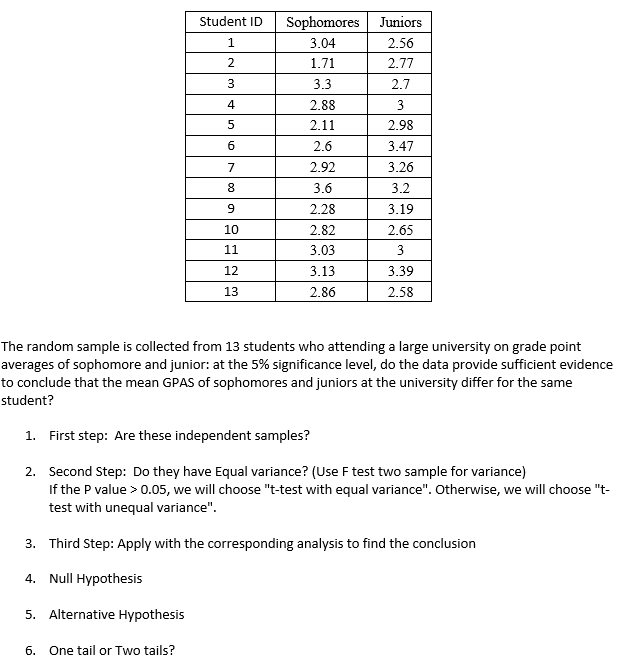
Student ID Sophomores Juniors 1 3.04 2.56 1.71 2.77 3.3 2.7 2.88 3 2.11 2.98 6 2.6 3.47 2.92 3.26 8 3.6 3.2 9 2.28 3.19 10 2.82 2.65 11 3.03 3 12 3.13 3.39 13 2.86 2.58 The random sample is collected from 13 students who attending a large university on grade point averages of sophomore and junior: at the 5% significance level, do the data provide sufficient evidence student? to conclude that the mean GPAS of sophomores and juniors at the university differ for the same 1. First step: Are these independent samples? 2. Second Step: Do they have Equal variance? (Use F test two sample for variance) If the P value > 0.05, we will choose "t-test with equal variance". Otherwise, we will choose "t- test with unequal variance". 3. Third Step: Apply with the corresponding analysis to find the conclusion 4. Null Hypothesis 5. Alternative Hypothesis 6. One tail or Two tails
Step by Step Solution
There are 3 Steps involved in it

Get step-by-step solutions from verified subject matter experts