

Question: Please help answer the highlighted questions with the graph listed above. The highlighted questions that i have answered are incorrect. Need help. The type of
Please help answer the highlighted questions with the graph listed above. The highlighted questions that i have answered are incorrect. Need help.
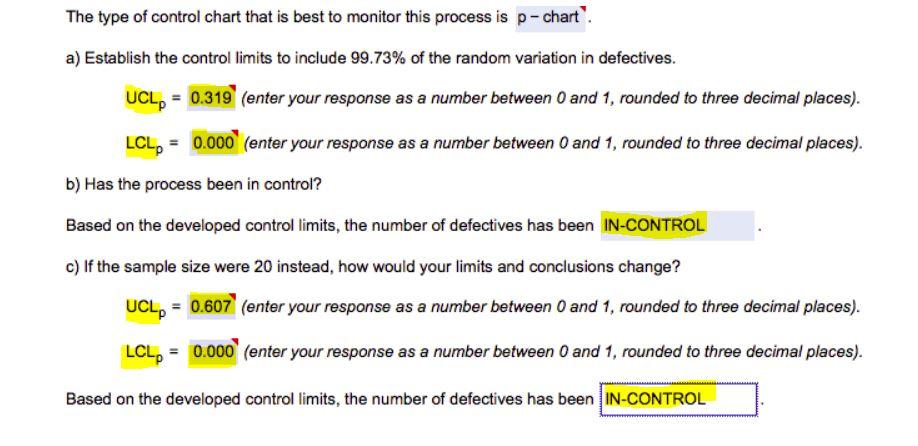
The type of control chart that is best to monitor this process is p-chart". a) Establish the control limits to include 99.73% of the random variation in defectives. UCL, = 0.319 (enter your response as a number between 0 and 1, rounded to three decimal places). LCL = 0.000 (enter your response as a number between 0 and 1, rounded to three decimal places). b) Has the process been in control? Based on the developed control limits, the number of defectives has been IN-CONTROL c) If the sample size were 20 instead, how would your limits and conclusions change? UCL = 0.607 (enter your response as a number between 0 and 1, rounded to three decimal places). LCLp = 0.000 (enter your response as a number between 0 and 1, rounded to three decimal places). Based on the developed control limits, the number of defectives has been IN-CONTROLStep by Step Solution
There are 3 Steps involved in it
1 Expert Approved Answer
Step: 1 Unlock

Question Has Been Solved by an Expert!
Get step-by-step solutions from verified subject matter experts
Step: 2 Unlock
Step: 3 Unlock