

Question: Please help answer the question in the photo standard normal table c t-table c Critical values chart Compute the sample correlation coefficient for the following
Please help answer the question in the photo
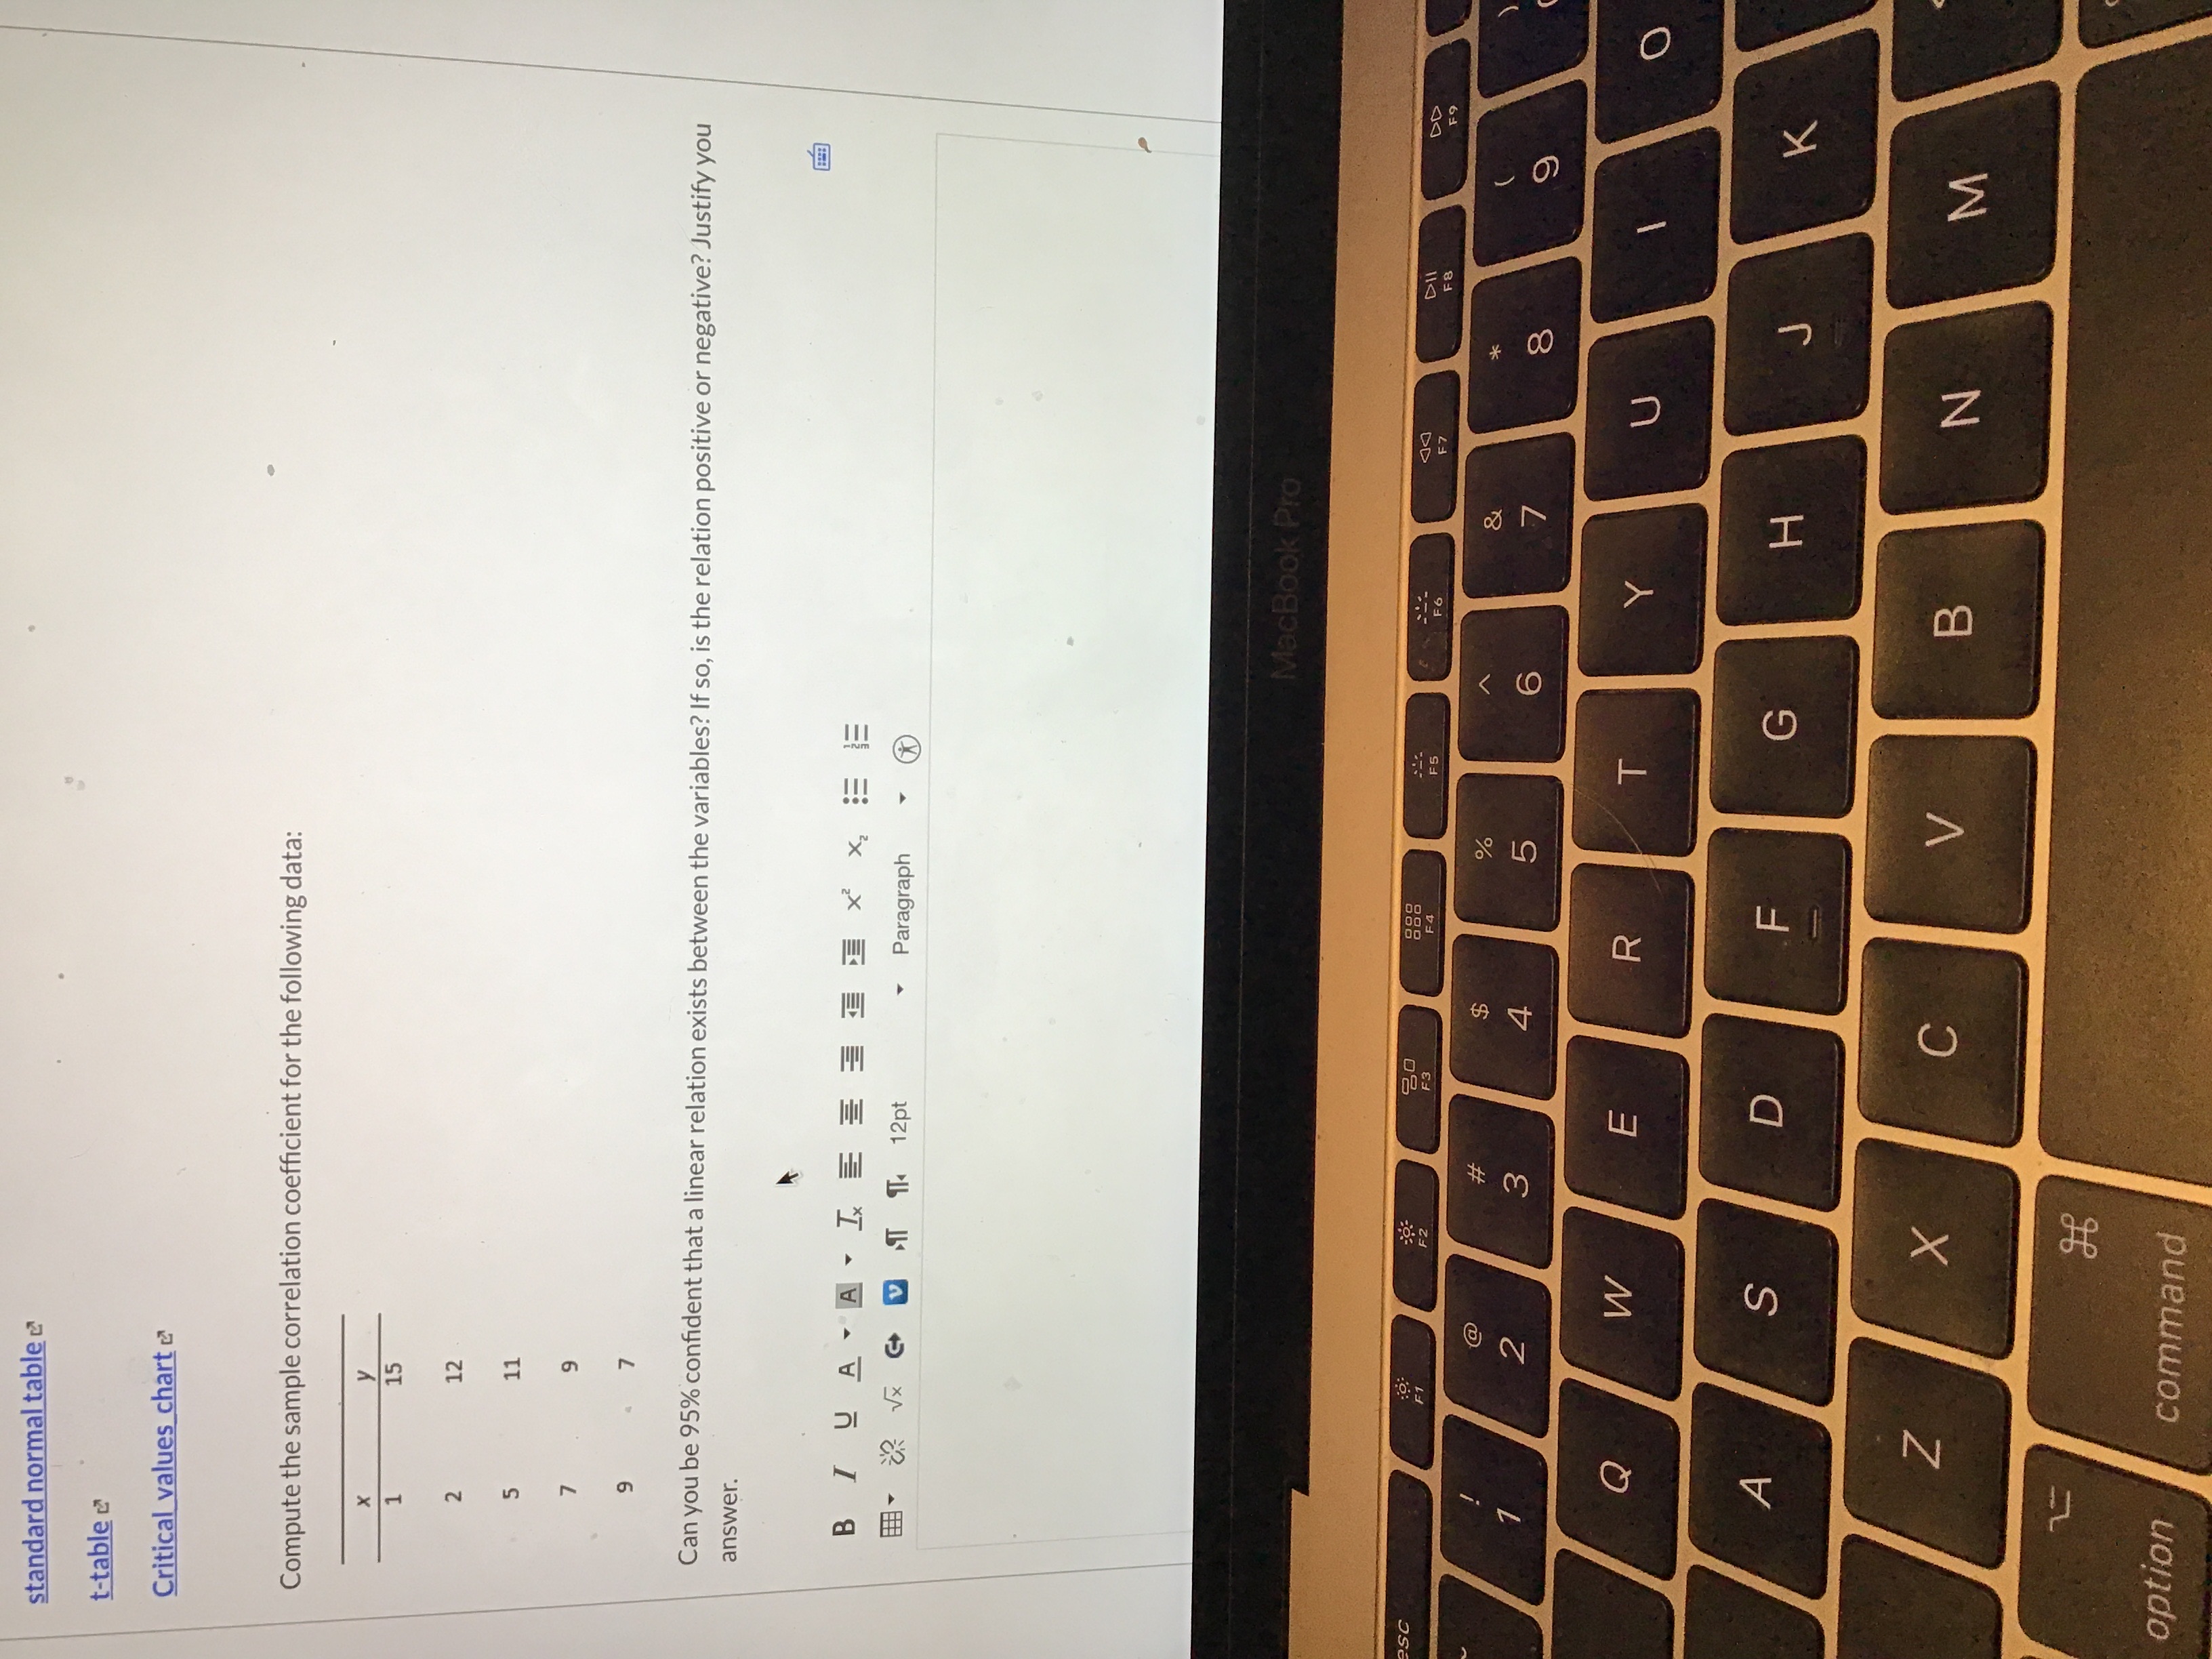
standard normal table c t-table c Critical values chart Compute the sample correlation coefficient for the following data: X 15 2 12 5 11 9 7 Can you be 95% confident that a linear relation exists between the variables? If so, is the relation positive or negative? Justify you answer. B IYA A . TELLXX - CR VX G V .T T 12 pt Paragraph MacBook Pro esc 20 F6 DD @ $ 2 W 5 6 7 Q W E R T Y U O A S D F G H K Z X C V B N M option command
Step by Step Solution
There are 3 Steps involved in it
1 Expert Approved Answer
Step: 1 Unlock

Question Has Been Solved by an Expert!
Get step-by-step solutions from verified subject matter experts
Step: 2 Unlock
Step: 3 Unlock