

Question: please help answer this, this is all one question Listed in the table below are altitudes (in thousands of feet) and outside air temperatures (in
please help answer this, this is all one question
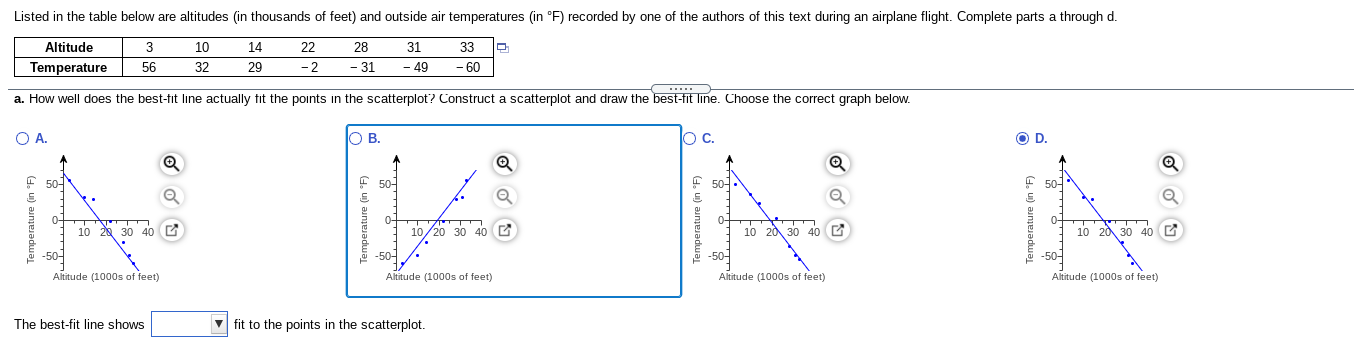
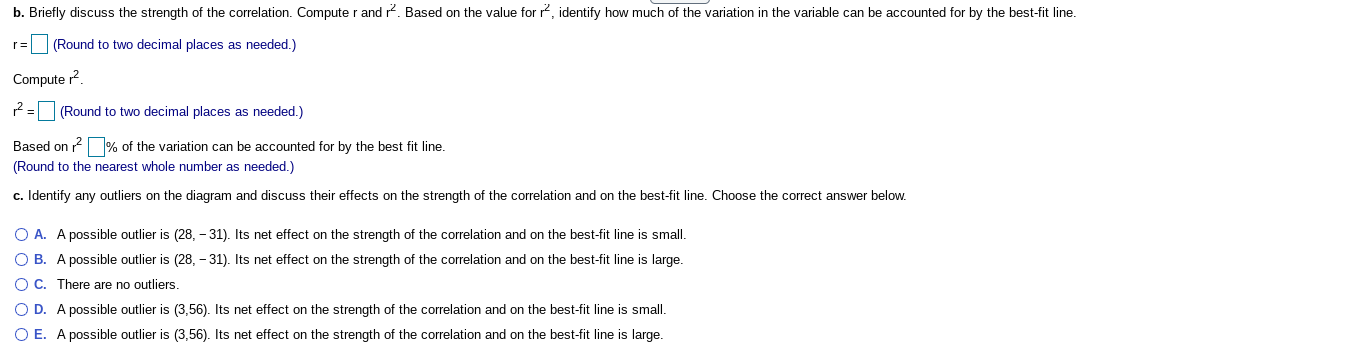
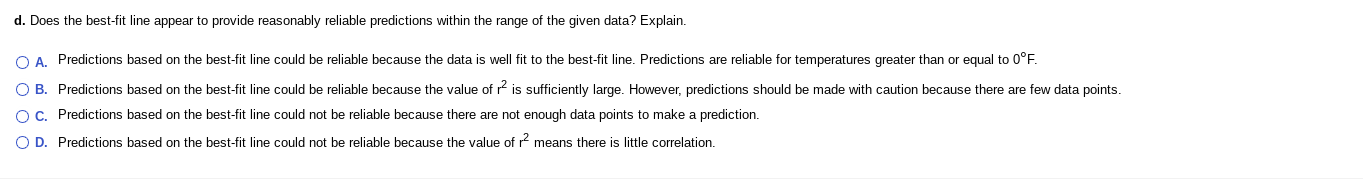
Listed in the table below are altitudes (in thousands of feet) and outside air temperatures (in F) recorded by one of the authors of this text during an airplane flight. Complete parts a through d. Altitude 3 10 14 22 28 31 33 Temperature 56 32 29 - 2 31 - 49 - 60 a. How well does the best-fit line actually fit the points in the scatterplot? Construct a scatterplot and draw the best-fit line. Choose the correct graph below. O A. O B. O C. OD. 50-7 50- 50- Temperature (in *F) Temperature (in *F) Temperature (in *F) Temperature (in 'F) 10 40 10/20 30 40 10 20 30 40 10 20 30 40 -50- -50- -50- -50- Altitude (1000s of feet) Altitude (1000s of feet) Altitude (1000s of feet) Altitude (1000s of feet) The best-fit line shows fit to the points in the scatterplot.b. Briefly discuss the strength of the correlation. Computer and r. Based on the value for , identify how much of the variation in the variable can be accounted for by the best-fit line. r= (Round to two decimal places as needed.) Computer. 12 =(Round to two decimal places as needed.) Based on 2 % of the variation can be accounted for by the best fit line. (Round to the nearest whole number as needed.) c. Identify any outliers on the diagram and discuss their effects on the strength of the correlation and on the best-fit line. Choose the correct answer below. O A. A possible outlier is (28, -31). Its net effect on the strength of the correlation and on the best-fit line is small. O B. A possible outlier is (28, -31). Its net effect on the strength of the correlation and on the best-fit line is large. O C. There are no outliers. O D. A possible outlier is (3,56). Its net effect on the strength of the correlation and on the best-fit line is small. O E. A possible outlier is (3,56). Its net effect on the strength of the correlation and on the best-fit line is large.d. Does the best-fit line appear to provide reasonably reliable predictions within the range of the given data? Explain. O A. Predictions based on the best-fit line could be reliable because the data is well fit to the best-fit line. Predictions are reliable for temperatures greater than or equal to O"F. O B. Predictions based on the best-fit line could be reliable because the value of r is sufficiently large. However, predictions should be made with caution because there are few data points. O C. Predictions based on the best-fit line could not be reliable because there are not enough data points to make a prediction. O D. Predictions based on the best-fit line could not be reliable because the value of r means there is little correlation
Step by Step Solution
There are 3 Steps involved in it

Get step-by-step solutions from verified subject matter experts