

Question: Please help answering highlighted questions 1(a,b)-5. Part 2 First Linear Regression A linear regression using SPSS was conducted with highschoolGRA. (high school GPA) as the
Please help answering highlighted questions 1(a,b)-5.
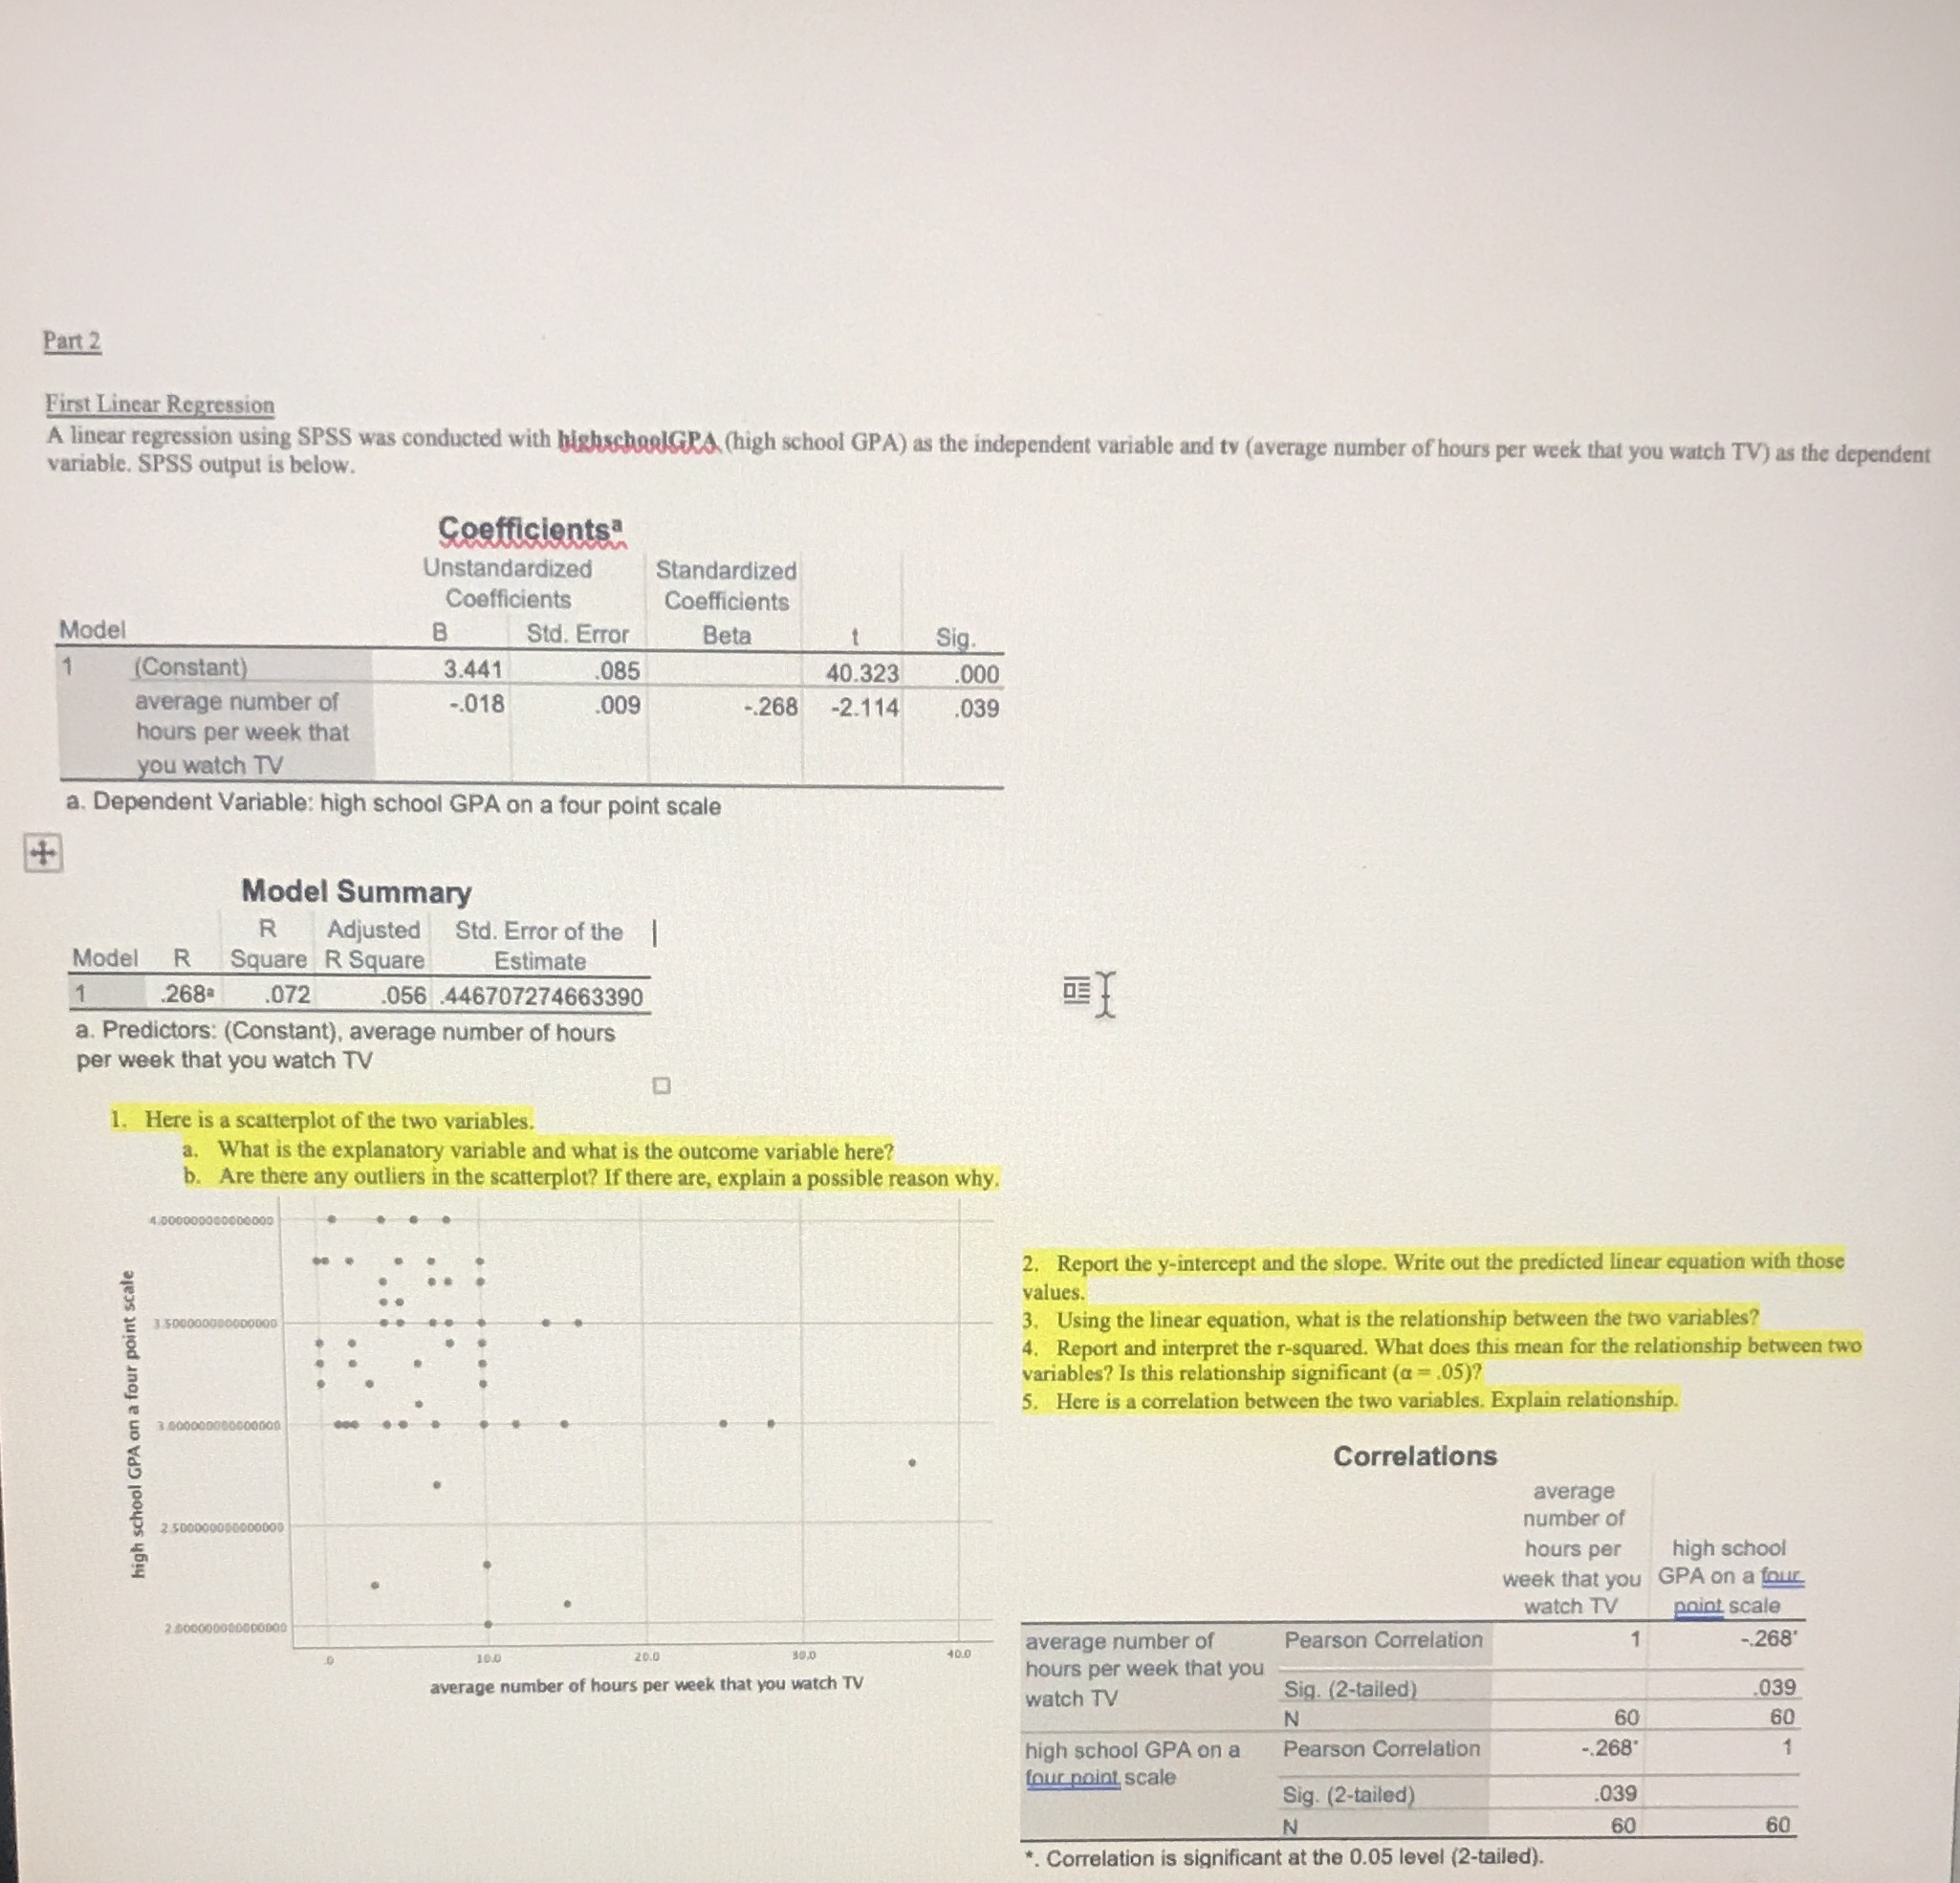
Part 2 First Linear Regression A linear regression using SPSS was conducted with highschoolGRA. (high school GPA) as the independent variable and ty (average number of hours per week that you watch TV) as the dependent variable. SPSS output is below. Coefficientsa Unstandardized Standardized Coefficients Coefficients Model B Std. Error Beta Sig. (Constant) 3.441 .085 40.323 .000 average number of -.018 .009 -.268 -2.114 039 hours per week that you watch TV a. Dependent Variable: high school GPA on a four point scale + Model Summary R Adjusted Std. Error of the Model R Square R Square Estimate 268: 072 056 .446707274663390 DET a. Predictors: (Constant), average number of hours per week that you watch TV 1. Here is a scatterplot of the two variables. a. What is the explanatory variable and what is the outcome variable here? b. Are there any outliers in the scatterplot? If there are, explain a possible reason why. 2. Report the y-intercept and the slope. Write out the predicted linear equation with those values. 3. Using the linear equation, what is the relationship between the two variables? 4. Report and interpret the r-squared. What does this mean for the relationship between two variables? Is this relationship significant (a = .05)? 5. Here is a correlation between the two variables. Explain relationship. high school GPA on a four point scale ODODOD Correlations average number of hours per high school week that you G u GPA on a four watch TV point scale Pearson Correlation -.268' 20.0 40.0 average number of hours per week that you average number of hours per week that you watch TV watch TV Sig. (2-tailed) 039 60 60 high school GPA on a Pearson Correlation .268' four point scale Sig. (2-tailed) 039 60 60 . Correlation is significant at the 0.05 level (2-tailed)
Step by Step Solution
There are 3 Steps involved in it

Get step-by-step solutions from verified subject matter experts