

Question: please help as much as you can & will get a lot of likes lots of students really need help 2 / 5 - 72%
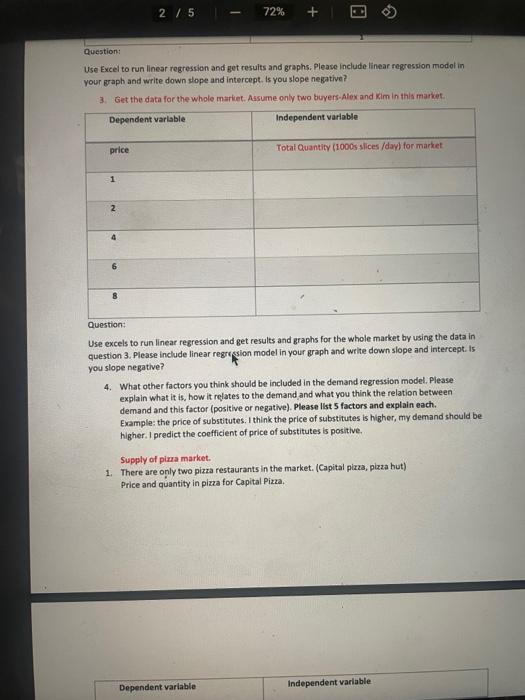
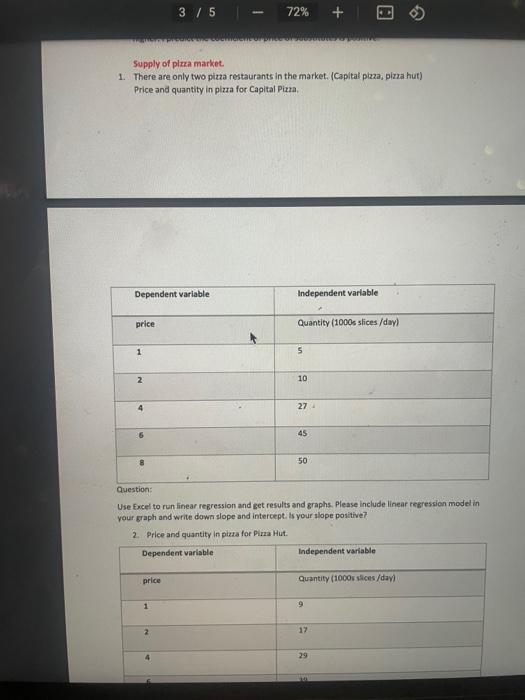
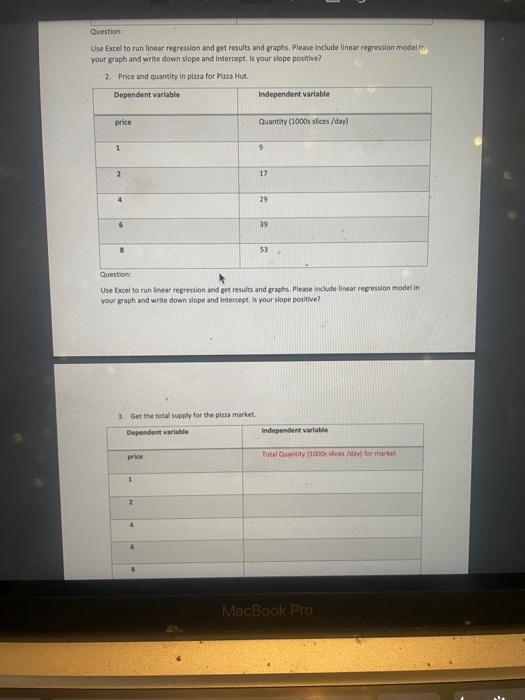
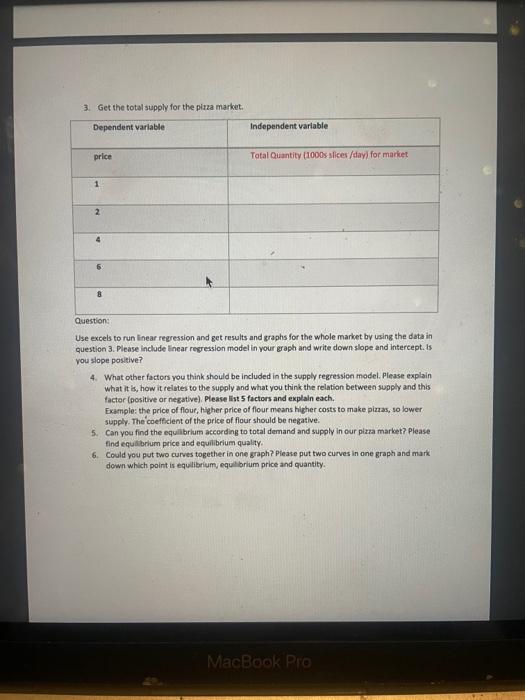
2 / 5 - 72% + + Question: Use Excel to run linear regression and get results and graphs. Please include linear regression model in your graph and write down slope and intercept. Is you slope negative? 3. Get the data for the whole market. Aasume only two buyers. Alex and Kim in the market. Dependent variable Independent variable price Total Quantity (1000s slices/day) for market 1 2 4 8 Question: Use excels to run linear regression and get results and graphs for the whole market by using the data in question 3. Please include linear regression model in your graph and write down slope and intercept. Is you slope negative? 4. What other factors you think should be included in the demand regression model. Please explain what it is, how it relates to the demand and what you think the relation between demand and this factor (positive or negative). Please list 5 factors and explain each. Example: the price of substitutes. I think the price of substitutes is higher, my demand should be higher. I predict the coefficient of price of substitutes is positive. Supply of pizza market. 1. There are only two pizza restaurants in the market. (Capital pizza, pizza hut) Price and quantity in pizza for Capital Pizza Dependent variable Independent variable 3/5 72% + + Supply of plaza market. 1. There are only two pizza restaurants in the market. (Capital plzza, pizza hut) Price and quantity in pizza for Capital Pizza, Dependent variable Independent variable price Quantity (1000s slices/day) 1 5 2 10 4 27 45 50 Question: Use Excel to run linear regression and get results and graphs. Please include linear regression model in your graph and write down slope and intercept. Is your slope positive? 2. Price and quantity in pizza for Pizza Hut. Dependent variable Independent variable price Quantity (1000 slices/day 1 9 2 29 Question Use Excel to run linear regression and get results and graphs. Please include linear regression modelin your graph and write down stope and intercept. Is your slope positive? 2. Price and quantity in pizza for Plura Hot. Dependent variable Independent variable price Quantity (1000s slices/day 1 9 2 17 4 29 39 3 53 Question Use Excel to run linear regression and get results and graphs. Please include linear regression modelin your graph and write down slope and intercept is your slope positive 3. Get the total supply for the piese market Dependent variable Independent variable price Total City 1000silica bom 1 2 4 6 MacBook Pro 3. Get the total supply for the pizza market, Dependent variable Independent variable price Total Quantity (1000s slices/day) for market 1 2 4 6 8 Question Use excels to run linear regression and get results and graphs for the whole market by using the data in Question 3. Please include linear regression model in your graph and write down slope and intercept. Is you slope positive? 4. What other factors you think should be included in the supply regression model. Please explain what it is, how it relates to the supply and what you think the relation between supply and this factor (positive or negative). Please list 5 factors and explain each. Example: the price of flour, higher price of flour means higher costs to make pizzas, so lower supply. The coefficient of the price of four should be negative. 5. Can you find the equilibrium according to total demand and supply in our pizza market? Please find equilibrium price and equilibrium quality 6. Could you put two curves together in one graph? Please put two curves in one graph and mark down which point is equilibrium, equilibrium price and quantity MacBook Pro 2 / 5 - 72% + + Question: Use Excel to run linear regression and get results and graphs. Please include linear regression model in your graph and write down slope and intercept. Is you slope negative? 3. Get the data for the whole market. Aasume only two buyers. Alex and Kim in the market. Dependent variable Independent variable price Total Quantity (1000s slices/day) for market 1 2 4 8 Question: Use excels to run linear regression and get results and graphs for the whole market by using the data in question 3. Please include linear regression model in your graph and write down slope and intercept. Is you slope negative? 4. What other factors you think should be included in the demand regression model. Please explain what it is, how it relates to the demand and what you think the relation between demand and this factor (positive or negative). Please list 5 factors and explain each. Example: the price of substitutes. I think the price of substitutes is higher, my demand should be higher. I predict the coefficient of price of substitutes is positive. Supply of pizza market. 1. There are only two pizza restaurants in the market. (Capital pizza, pizza hut) Price and quantity in pizza for Capital Pizza Dependent variable Independent variable 3/5 72% + + Supply of plaza market. 1. There are only two pizza restaurants in the market. (Capital plzza, pizza hut) Price and quantity in pizza for Capital Pizza, Dependent variable Independent variable price Quantity (1000s slices/day) 1 5 2 10 4 27 45 50 Question: Use Excel to run linear regression and get results and graphs. Please include linear regression model in your graph and write down slope and intercept. Is your slope positive? 2. Price and quantity in pizza for Pizza Hut. Dependent variable Independent variable price Quantity (1000 slices/day 1 9 2 29 Question Use Excel to run linear regression and get results and graphs. Please include linear regression modelin your graph and write down stope and intercept. Is your slope positive? 2. Price and quantity in pizza for Plura Hot. Dependent variable Independent variable price Quantity (1000s slices/day 1 9 2 17 4 29 39 3 53 Question Use Excel to run linear regression and get results and graphs. Please include linear regression modelin your graph and write down slope and intercept is your slope positive 3. Get the total supply for the piese market Dependent variable Independent variable price Total City 1000silica bom 1 2 4 6 MacBook Pro 3. Get the total supply for the pizza market, Dependent variable Independent variable price Total Quantity (1000s slices/day) for market 1 2 4 6 8 Question Use excels to run linear regression and get results and graphs for the whole market by using the data in Question 3. Please include linear regression model in your graph and write down slope and intercept. Is you slope positive? 4. What other factors you think should be included in the supply regression model. Please explain what it is, how it relates to the supply and what you think the relation between supply and this factor (positive or negative). Please list 5 factors and explain each. Example: the price of flour, higher price of flour means higher costs to make pizzas, so lower supply. The coefficient of the price of four should be negative. 5. Can you find the equilibrium according to total demand and supply in our pizza market? Please find equilibrium price and equilibrium quality 6. Could you put two curves together in one graph? Please put two curves in one graph and mark down which point is equilibrium, equilibrium price and quantity MacBook Pro
Step by Step Solution
There are 3 Steps involved in it

Get step-by-step solutions from verified subject matter experts