

Question: please help asap!! 1) Do ratios for 2019 data and use 2019 Income Statement and 2019 Balance Sheet Information in Apple's Annual Report; write in
please help asap!! 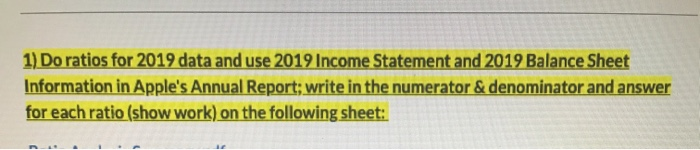
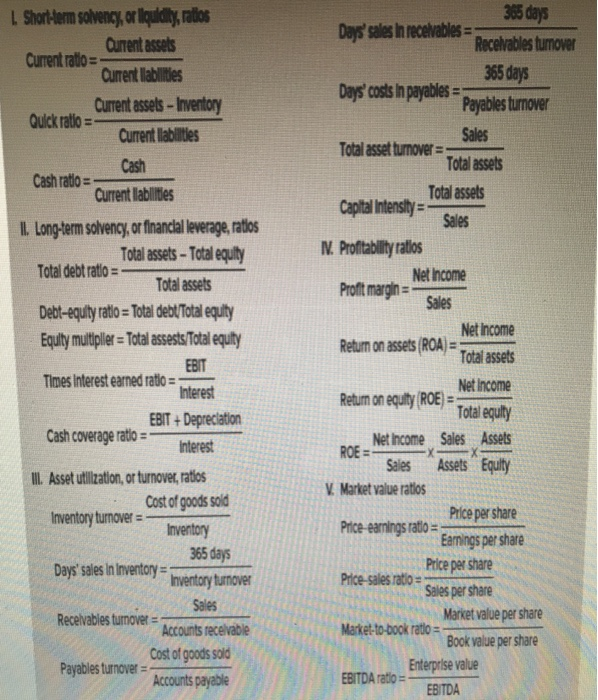

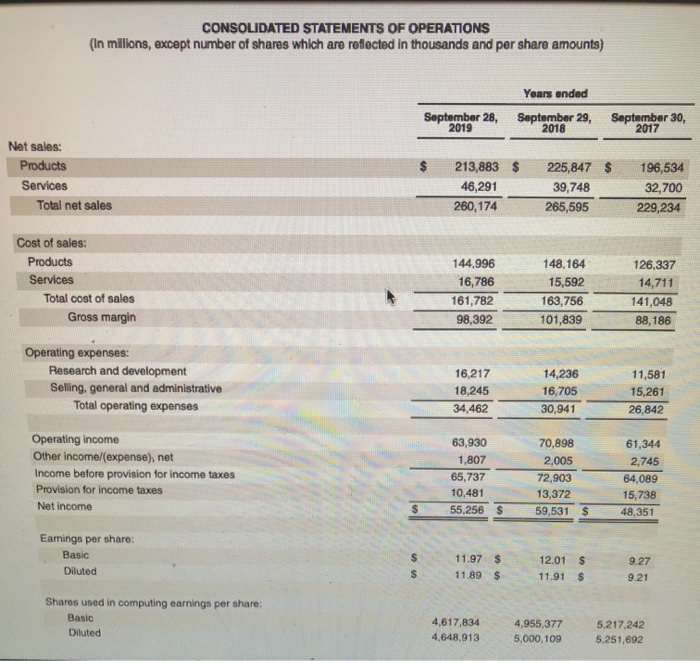
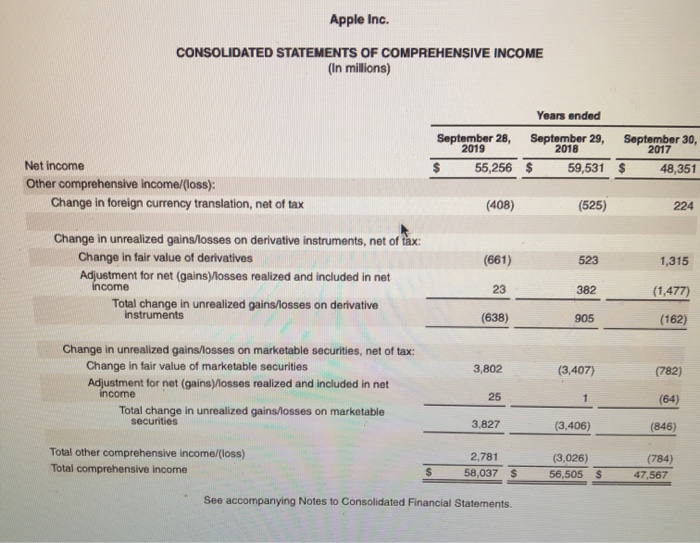
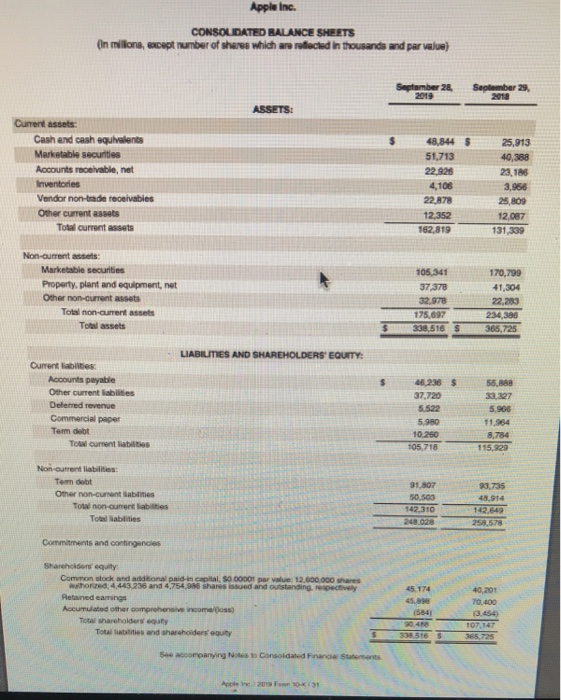
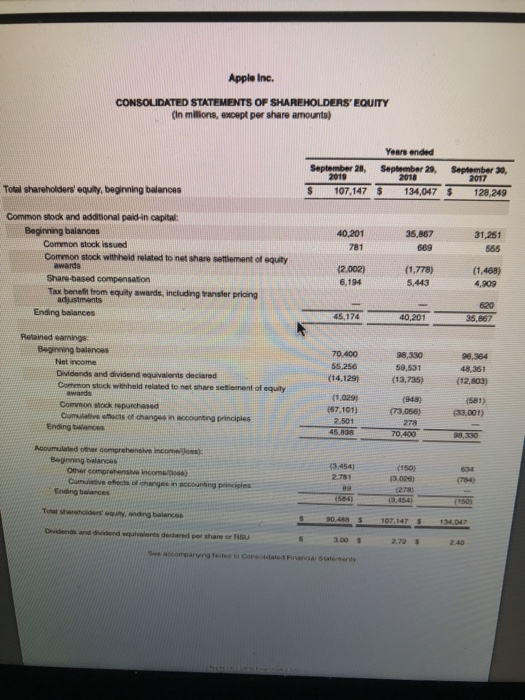
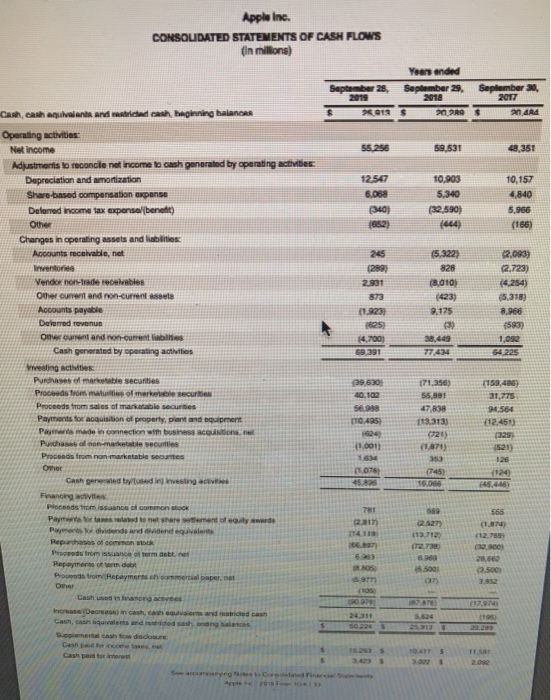
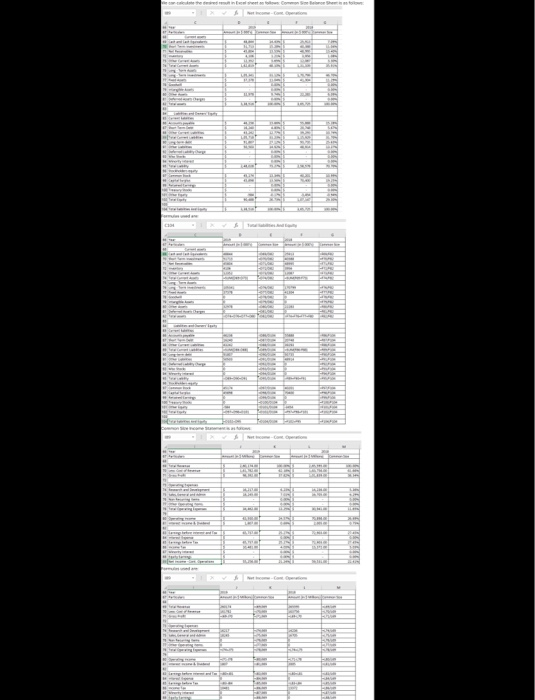
1) Do ratios for 2019 data and use 2019 Income Statement and 2019 Balance Sheet Information in Apple's Annual Report; write in the numerator & denominator and answer for each ratio (show work) on the following sheet: Short-term solvency, or liquidity, ratios Current assets Current ratio =- Current labilities Current assets - Inventory Quick ratio = Current llabilities Cash Cash ratio = Current llabilities II. Long-term solvency, or financial leverage, ratlos Total assets - Total equity Total debt ratio Total assets Debt-equity ratio = Total debt/Total equity Equity multiplier = Total assests/Total equity EBIT Times Interest earned ratio = Interest EBIT + Depreciation Cash coverage ratio = Interest IL Asset utilization, or turnover, ratios Cost of goods sold Inventory turnover = Inventory 365 days Days' sales In Inventory = Inventory turnover Sales Recelvables turnover Accounts receivable Cost of goods sold Payables turnover = Accounts payable 365 days Days' sales in recevables = Receivables tumover 365 days Days' costs In payables = Payables turnover Sales Total asset turnover = Total assets Total assets Capital Intensity = - Sales N. Profitability ratlos Net Income Profit margin= Sales Net Income Return on assets (ROA) = Total assets Net Income Return on equity (ROE) = Total equity Net Income Sales Assets ROE = Sales Assets Equity V. Market value ratlos Price per share Price-earnings ratio = Earnings per share Price per share Price-sales ratio Sales per share Market value per share Market-to-book ratio = Book value per share Enterprise value EBITDA ratio EBITDA You can either enter numbers in Excel and do the calculations electronically and upload the spreadsheet file or use a calculator and show work for calculations on the ratio analysis PDF sheet I provided above, then submit as a PDF CONSOLIDATED STATEMENTS OF OPERATIONS (In millions, except number of shares which are reflected in thousands and per share amounts) September 28, 2019 Years anded September 29, 2018 September 30, 2017 $ Net sales: Products Services Total net sales 213,883 $ 46,291 260,174 225,847 $ 39,748 265,595 196,534 32,700 229,234 Cost of sales: Products Services Total cost of sales Gross margin 144,996 16,786 161,782 98,392 148,164 15,592 163,756 101,839 126,337 14,711 141,048 88,186 Operating expenses: Research and development Selling, general and administrative Total operating expenses 16,217 18,245 34,462 14,236 16,705 30,941 11,581 15,261 26,842 Operating income Other income/expense), net Income before provision for income taxes Provision for income taxes Net income 63,930 1,807 65,737 10,481 55,256 $ 70,898 2,005 72,903 13,372 59,531 $ 61,344 2,745 64,089 15,738 48,351 S Earnings per share: Basic Diluted $ $ 11.97 $ 11.89 $ 12.01 S 11.91 $ 9.27 9.21 Shares used in computing earnings per share: Basic Diluted 4,617,834 4,648,913 4,955,377 5,000,109 5.217.242 5,251,692 Apple Inc. CONSOLIDATED STATEMENTS OF COMPREHENSIVE INCOME (In millions) Years ended September 28, September 29, September 30, 2019 2018 2017 $ 55,256 $ 59,531 $ 48,351 Net income Other comprehensive income/(loss): Change in foreign currency translation, net of tax (408) (525) 224 (661) 523 1,315 Change in unrealized gains/losses on derivative Instruments, net of tax: Change in fair value of derivatives Adjustment for net (gains)Mosses realized and included in net Total change in unrealized gains/losses on derivative instruments income 23 382 (1,477) (638) 905 (162) 3,802 (3,407) (782) Change in unrealized gains/losses on marketable securities, net of tax: Change in fair value of marketable securities Adjustment for net (gains)/losses realized and included in net income Total change in unrealized gains/losses on marketable securities 25 1 (64) 3,827 (3,406) (846) Total other comprehensive income/loss) Total comprehensive income 2.781 58,037 S (3,026) 56,505 $ (784) 47,567 $ See accompanying Notes to Consolidated Financial Statements Apple Inc. CONSOLIDATED BALANCE SHEETS On millons, except rumber of shares which are reflected in thousands and par value) September 26, 2019 September 29, 2018 ASSETS: Current assets: Cash and cash equivalents Marketable securities Accounts receivable, net Inventories Vendor non-trade receivables Other current assets Total current assets 48,844 5 51,713 22926 4,105 22,878 12,352 162.819 25,913 40,388 23,186 3,956 25.809 12,087 131,339 Non-current assets: Marketable securities Property, plant and equipment, net Other non-current assets Total non-current assets Total assets 105.341 37,378 32.978 175.697 338,516 170,799 41,304 22,283 234,386 365,725 LIABILITIES AND SHAREHOLDERS' EQUITY: Current liabilities: Accounts payable Other current abilities Deferred revenue Commercial paper Tem debt Total current liabilities 46.236 $ 37.720 5.522 5.980 10.250 105.718 55.889 33,327 5.900 11.954 8,784 115.829 Non-current liabilities: Te debt Other non-current abilities Total non-current liabilities Total liabilities 91,807 50 503 142310 248.028 93.735 48.914 142.649 258.578 Commitments and contingencies Shareholder equity Common stock and additional paid in capital, SO 00001 par value: 12.600.000 shares worze: 4.443.236 and 4754,985 shares issued and outstanding, respectively Retained earrings Accumulated other comprehensive income poss Total shareholders gut Total ties and shareholders equity 45. 174 45. Se (584) 40,201 70.400 3.454) 107,147 365,725 331 516 5 See moanying to consolidated Financial Statements Arie 2018 06:31 Apple Inc. CONSOLIDATED STATEMENTS OF SHAREHOLDERS' EQUITY (In milions, except per share amounts) Years ended September 28, September 29, September 30, 2019 2018 2017 $ 107,147 $ 134,047 $ 128,249 Total shareholders equity, beginning balances 40.201 781 36,867 689 31,251 556 Common rock and additional paid in capital Beginning balances Common stock issued Common stock withheld related to not share settlement of equity awards Share-based compensation Tax benefit from equity awards, including ansler pricing adjustments Ending balances (2.002) 6,194 (1.778) 5,443 (1,468) 45.174 620 35,867 40,201 Retained earnings Beginning balances Net income Dividends and dividend equivalent declared Con stock whold related to net share settiment of equity awards Common stock repurchased Cumulative acts of changes in accounting principles Ending ances 70.400 55 256 (14,129) 98,330 59,531 (13,735) 48.361 (12.803) (581) (1.0291 (67.101) 2501 45,828 (941) T3.066) 278 70,400 Acumulated the comprehensive income Being balances Other comprehensive income) Curved changes in accounting principles 13.4541 2.781 (150) 13.028) (278) (584) To shareholders ending balances 30.435 107,147 134047 Dividend dividend equivalent declared porshare or SU 2.725 Apple Inc. CONSOLIDATED STATEMENTS OF CASH FLOWS (in millions) Yeer ended September 28, September September 30, 2018 2018 2017 $ 26.013 $ 20.99 $ 2n Ad 59.531 49,351 12.547 6.068 (340) 1852 10.903 5.340 (32,590) 10,157 4,840 5,966 (166) (289) 2.301 873 (1.9233 1625) 14,700) 69 391 (5,322) 828 (8,010) (423) 9,175 3 2,093) (2.723) (4.254) (5,318) 8.966 (593) 1,092 54 225 77 434 Cash, cash avants and restricted cash, beginning balances Operating activities Net Income Adjustments to reconcile net income to cash generated by operating activities Depreciation and amonization Share-based compensation expense Deferred income tax expenselbenele) Other Changes in operating assets and liabilities Accounts receivable, net Inwentong Vendo de recevables Omerounvent and non-current els Accounts payable Deferred revenue One and on-currenties Cash generated by operating activities Westing this Purchase of marketable securities Proceeds from matures of markere secure Proceeds from sales of marketable securities Payments for acquisition of property, plant and equipment Payment made innection with business count Purchase of non- metable securities Prends from non-marketable securities Other Cash gered by used in investing activiti Financing actie Plocos romance common stock Paytares led to net share some of my words Pershends and videndegavlen Repurchases of common stock Proceedince for det Pepayments of a debt Propostrom Repayments comercial paper.net Omer Cash anong actes Increase Decrease in cash, cash valents and tried cash Casquivalents and schedashes Suplemental cash flow disclosure Cash adres, Cash pairs 39.530 30.102 56.988 T0435 1904 (1.0011 1614 11.0781 45.826 171,356) 55,881 47.838 13,313) (721) (1871) 350 (745) 16.00 159,486) 31,775 94.564 [12.451) (329 521) 126 (124) 669 781 Rain 16. 1137123 IT2.73 6.989 5. Soos 555 (1. 12,755) 2.300) 20.00 (3.500 59771 5.624 5 045 3.0025 2.02 PUU TELL THE CEWER ESTELLT AL 2011 1909 MULLE ALEBO SEBESAR ER TER MEELELA ANASA BESA TELE HELLE
Step by Step Solution
There are 3 Steps involved in it

Get step-by-step solutions from verified subject matter experts