

Question: please help ASAP. I just need #2-6 ---INFO: --- --- --- PLEASE HELP ON THE PIVOT TABLES (#2-6) THANK YOU!! Use the attached Excel data
please help ASAP. I just need #2-6
---INFO:
---
---
---
PLEASE HELP ON THE PIVOT TABLES (#2-6) THANK YOU!!
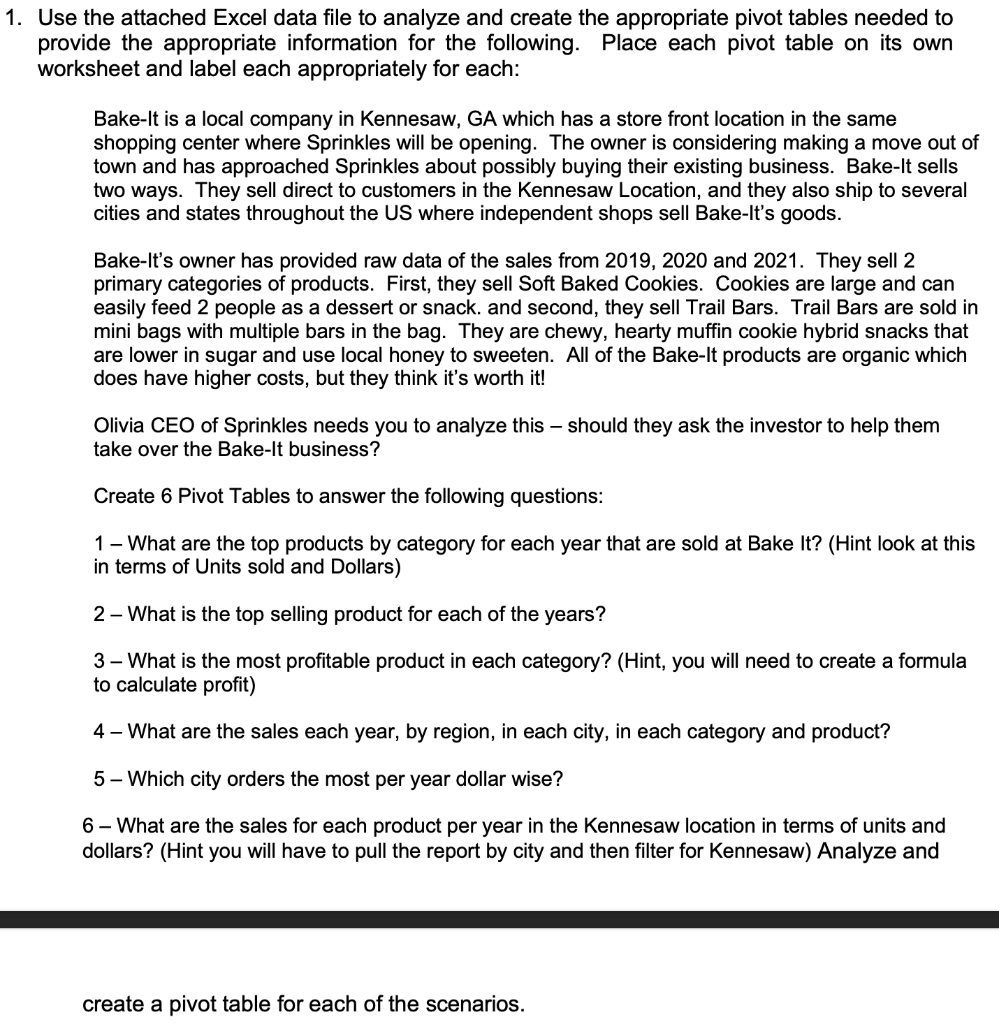
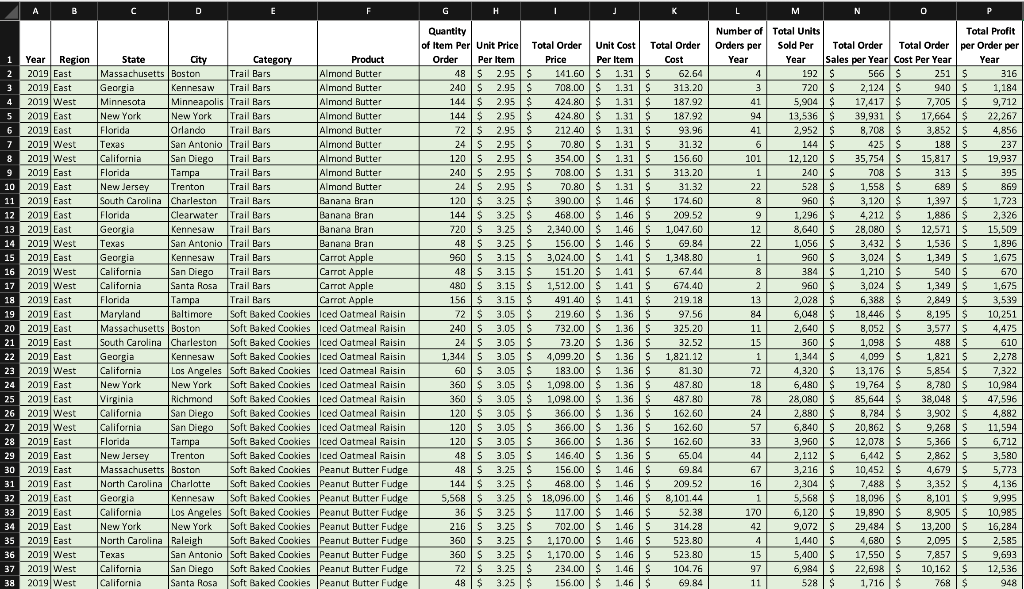
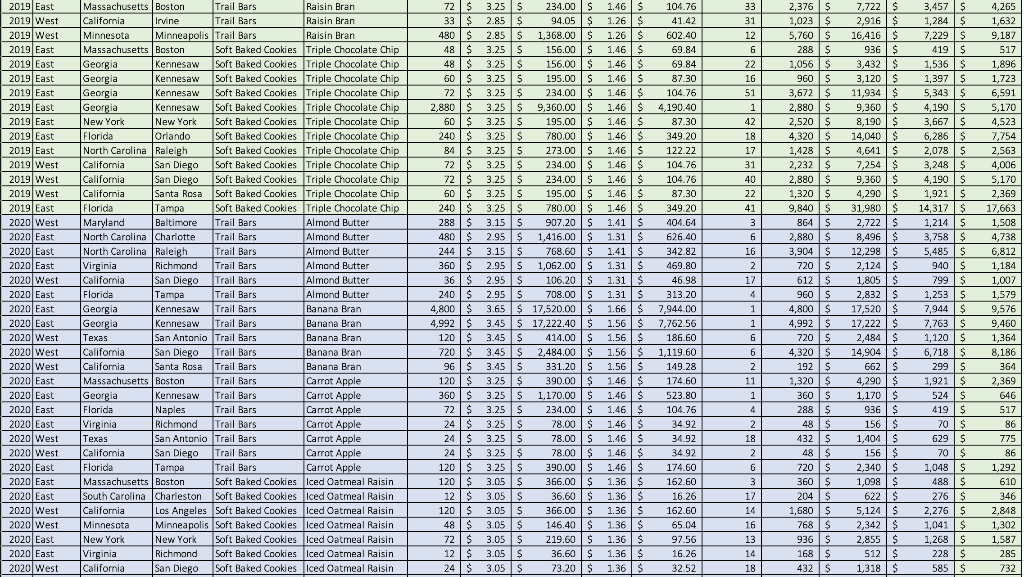
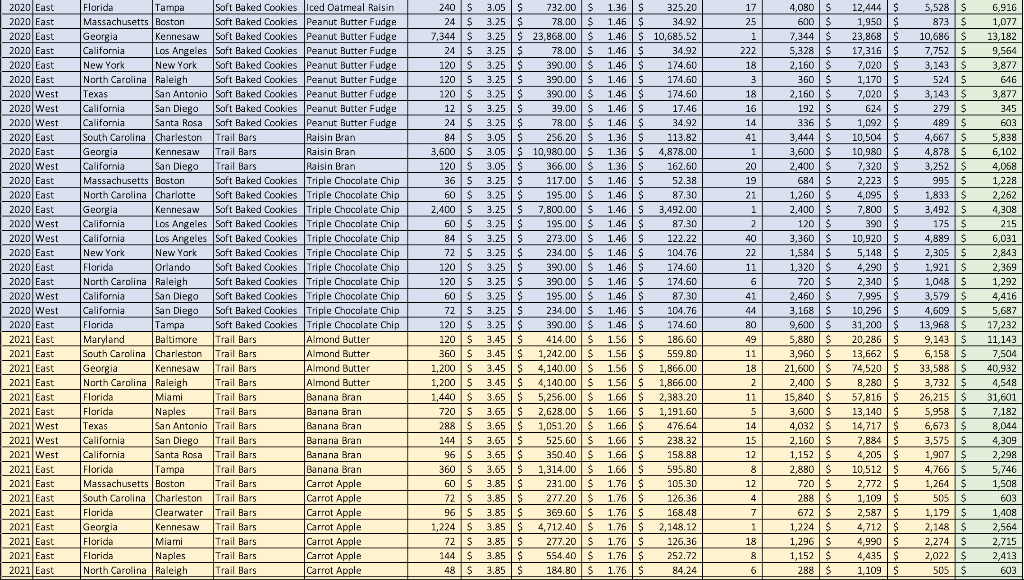
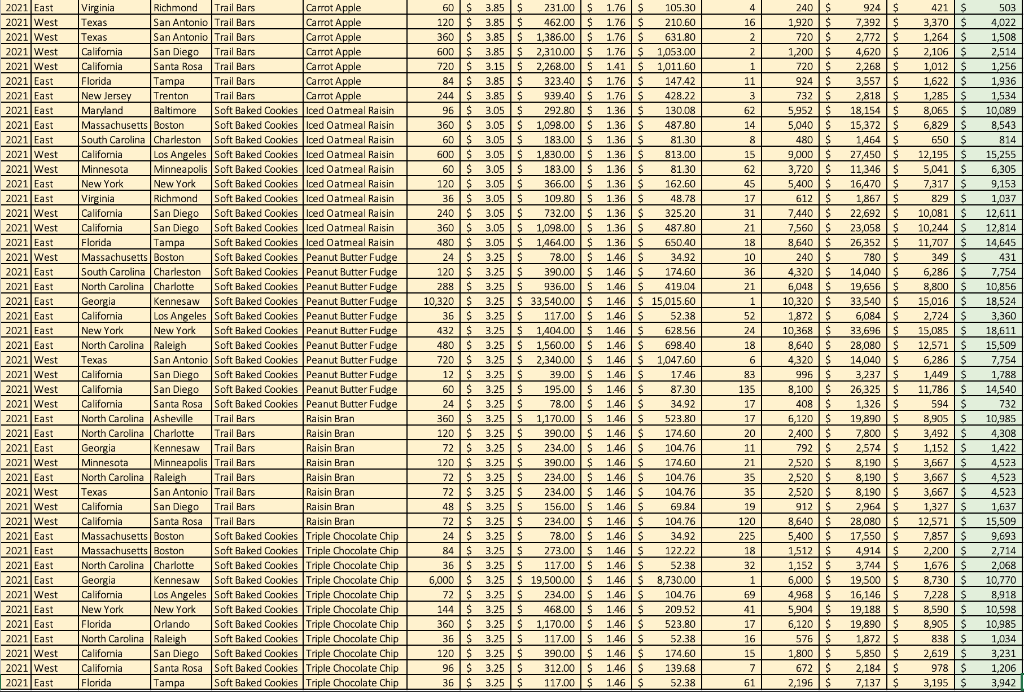
Use the attached Excel data file to analyze and create the appropriate pivot tables needed to provide the appropriate information for the following. Place each pivot table on its own worksheet and label each appropriately for each: Bake-It is a local company in Kennesaw, GA which has a store front location in the same shopping center where Sprinkles will be opening. The owner is considering making a move out of town and has approached Sprinkles about possibly buying their existing business. Bake-lt sells two ways. They sell direct to customers in the Kennesaw Location, and they also ship to several cities and states throughout the US where independent shops sell Bake-It's goods. Bake-It's owner has provided raw data of the sales from 2019, 2020 and 2021. They sell 2 primary categories of products. First, they sell Soft Baked Cookies. Cookies are large and can easily feed 2 people as a dessert or snack. and second, they sell Trail Bars. Trail Bars are sold in mini bags with multiple bars in the bag. They are chewy, hearty muffin cookie hybrid snacks that are lower in sugar and use local honey to sweeten. All of the Bake-It products are organic which does have higher costs, but they think it's worth it! Olivia CEO of Sprinkles needs you to analyze this - should they ask the investor to help them take over the Bake-It business? Create 6 Pivot Tables to answer the following questions: 1 - What are the top products by category for each year that are sold at Bake It? (Hint look at this in terms of Units sold and Dollars) 2 - What is the top selling product for each of the years? 3 - What is the most profitable product in each category? (Hint, you will need to create a formula to calculate profit) 4 - What are the sales each year, by region, in each city, in each category and product? 5 - Which city orders the most per year dollar wise? 6 - What are the sales for each product per year in the Kennesaw location in terms of units and dollars? (Hint you will have to pull the report by city and then filter for Kennesaw) Analyze and create a pivot table for each of the scenarios. Use the attached Excel data file to analyze and create the appropriate pivot tables needed to provide the appropriate information for the following. Place each pivot table on its own worksheet and label each appropriately for each: Bake-It is a local company in Kennesaw, GA which has a store front location in the same shopping center where Sprinkles will be opening. The owner is considering making a move out of town and has approached Sprinkles about possibly buying their existing business. Bake-lt sells two ways. They sell direct to customers in the Kennesaw Location, and they also ship to several cities and states throughout the US where independent shops sell Bake-It's goods. Bake-It's owner has provided raw data of the sales from 2019, 2020 and 2021. They sell 2 primary categories of products. First, they sell Soft Baked Cookies. Cookies are large and can easily feed 2 people as a dessert or snack. and second, they sell Trail Bars. Trail Bars are sold in mini bags with multiple bars in the bag. They are chewy, hearty muffin cookie hybrid snacks that are lower in sugar and use local honey to sweeten. All of the Bake-It products are organic which does have higher costs, but they think it's worth it! Olivia CEO of Sprinkles needs you to analyze this - should they ask the investor to help them take over the Bake-It business? Create 6 Pivot Tables to answer the following questions: 1 - What are the top products by category for each year that are sold at Bake It? (Hint look at this in terms of Units sold and Dollars) 2 - What is the top selling product for each of the years? 3 - What is the most profitable product in each category? (Hint, you will need to create a formula to calculate profit) 4 - What are the sales each year, by region, in each city, in each category and product? 5 - Which city orders the most per year dollar wise? 6 - What are the sales for each product per year in the Kennesaw location in terms of units and dollars? (Hint you will have to pull the report by city and then filter for Kennesaw) Analyze and create a pivot table for each of the scenarios
Step by Step Solution
There are 3 Steps involved in it

Get step-by-step solutions from verified subject matter experts