

Question: Please help ASAP Q13. The graphs below show the the impulse response diagrams from estimating a VAR model with the Cholesky ordering ALGPRICE and INF.
Please help ASAP
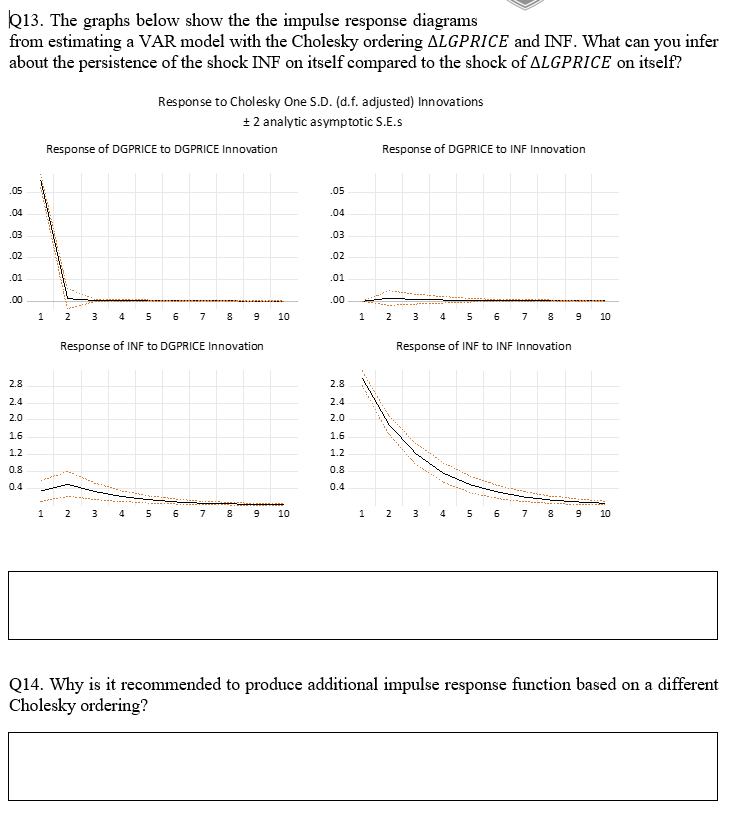
Q13. The graphs below show the the impulse response diagrams from estimating a VAR model with the Cholesky ordering ALGPRICE and INF. What can you infer about the persistence of the shock INF on itself compared to the shock of ALGPRICE on itself? Response to Cholesky One S.D. (d.f. adjusted) Innovations + 2 analytic asymptotic S.E.s Response of DGPRICE to INF Innovation Response of DGPRICE to DGPRICE Innovation 05 .05 .04 .04 .03 .03 02 .02 .01 .01 00 3 4 5 6 9 1 2 10 1 2 3 4 5 6 7 9 10 Response of INF to INF Innov Response of INF to DGPRICE Innovation 2.8 2.8 2.4 2.4 2.0 2.0 1.6 /.. . . . .pat 1.6 1.2 1.2 . ... .... 0.8 0.8 . . . . . 0.4 9 10 9 10 1 2 3 4 5 6 7 1 2 3 4 5 6 7 Q14. Why is it recommended to produce additional impulse response function based on a different Cholesky ordering
Step by Step Solution
There are 3 Steps involved in it

Get step-by-step solutions from verified subject matter experts