

Question: Please help ASAP question #26 CVP Chart Analysis Break-Even Chart 1,200,000 1,000,000 Total Revenue 800,000 . US$ 600,000 Total Variable costs 400,000 Total Costs Total
Please help ASAP
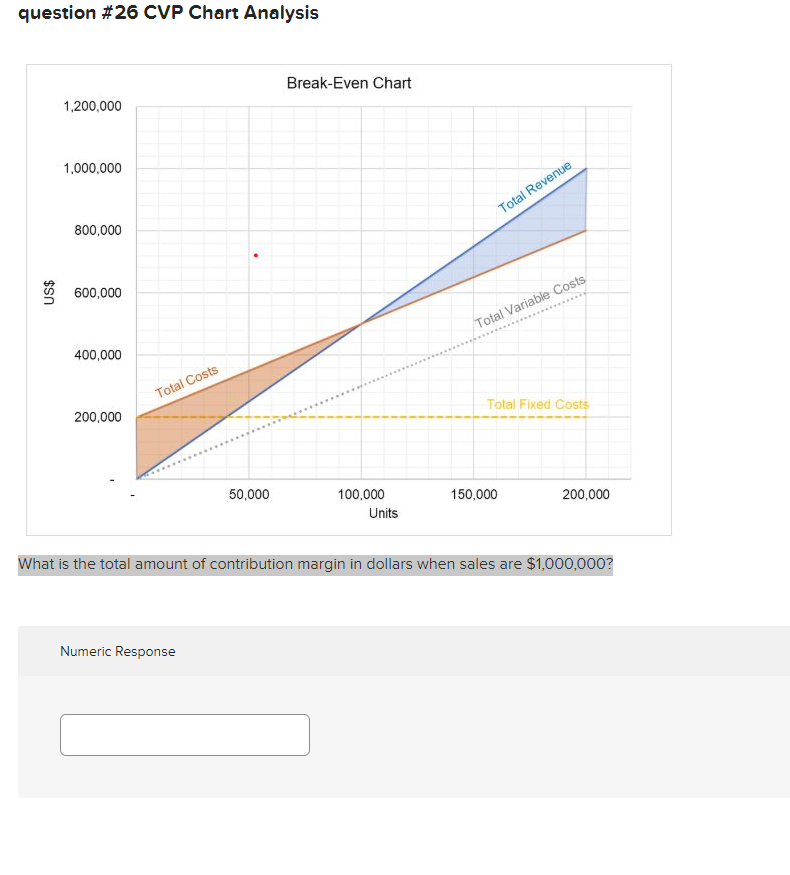
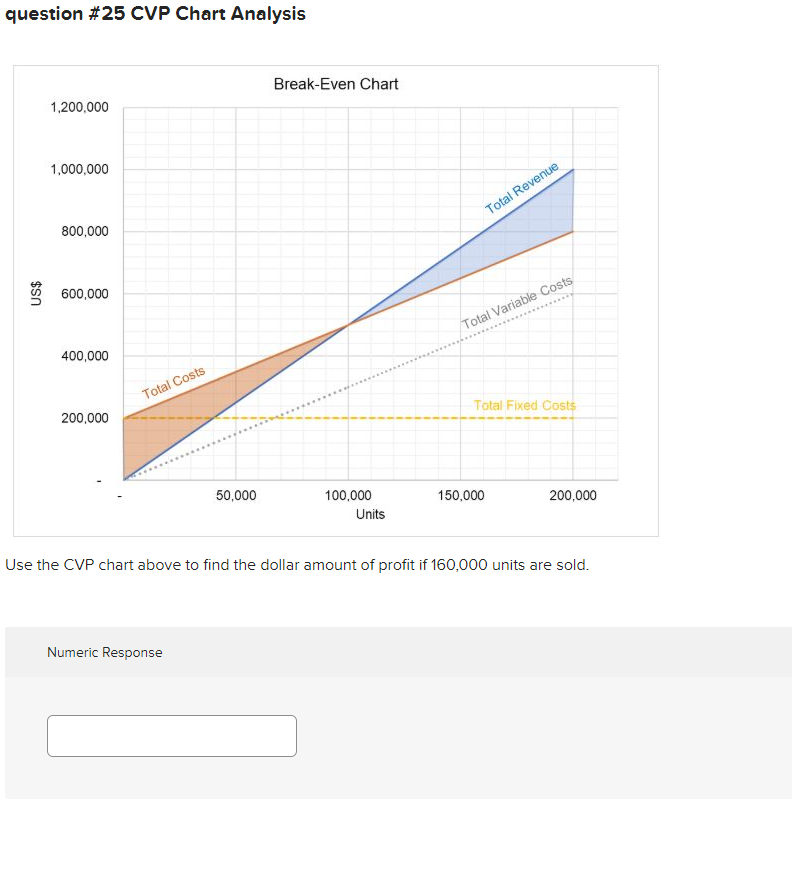
question #26 CVP Chart Analysis Break-Even Chart 1,200,000 1,000,000 Total Revenue 800,000 . US$ 600,000 Total Variable costs 400,000 Total Costs Total Fixed Costs 200,000 50,000 150,000 200,000 100,000 Units What is the total amount of contribution margin in dollars when sales are $1,000,000? Numeric Response question #25 CVP Chart Analysis Break-Even Chart 1,200,000 1,000,000 Total Revenue 800,000 US$ 600,000 Total Variable Costs 400,000 Total Costs Total Fixed Costs 200,000 50,000 150,000 200,000 100,000 Units Use the CVP chart above to find the dollar amount of profit if 160,000 units are sold. Numeric Response
Step by Step Solution
There are 3 Steps involved in it
1 Expert Approved Answer
Step: 1 Unlock

Question Has Been Solved by an Expert!
Get step-by-step solutions from verified subject matter experts
Step: 2 Unlock
Step: 3 Unlock