

Question: please help asap! Question type: Forecasting The monthly sales for Otter Batteries, Inc, were as follows: a Plot the monthly sales data. b Forecast January
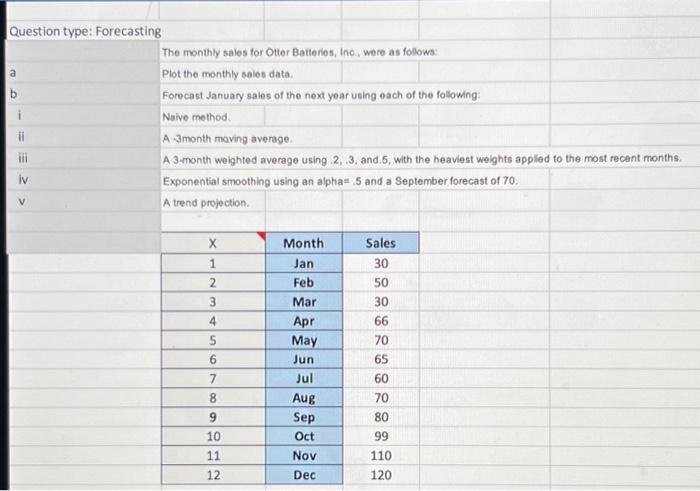
Question type: Forecasting The monthly sales for Otter Batteries, Inc, were as follows: a Plot the monthly sales data. b Forecast January sales of the next year using each of the following: Naive method. A 3 month maving average. A 3 -month weighted average using 2,3 , and.5, with the heaviest weights appled to the most recent months. Exponential smoothing using an alpha =.5 and a September forecast of 70 . A trend projection. \begin{tabular}{|c|c|c|} \hlineX & Month & Sales \\ \hline 1 & Jan & 30 \\ \hline 2 & Feb & 50 \\ \hline 3 & Mar & 30 \\ \hline 4 & Apr & 66 \\ \hline 5 & May & 70 \\ \hline 6 & Jun & 65 \\ \hline 7 & Jul & 60 \\ \hline 8 & Aug & 70 \\ \hline 9 & Sep & 80 \\ \hline 10 & Oct & 99 \\ \hline 11 & Nov & 110 \\ \hline 12 & Dec & 120 \\ \hline \end{tabular}
Step by Step Solution
There are 3 Steps involved in it

Get step-by-step solutions from verified subject matter experts