

Question: please help ASAP. solve showing formulas/how to create pivot table etc in EXCEL. (I know it says 5 stocks) but I only need to learn
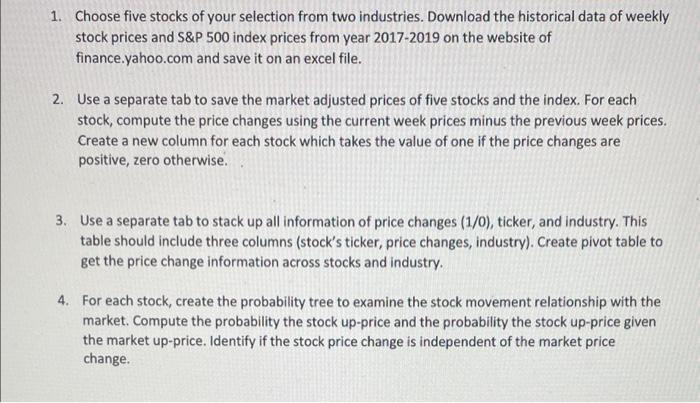
1. Choose five stocks of your selection from two industries. Download the historical data of weekly stock prices and S\&P 500 index prices from year 2017-2019 on the website of finance.yahoo.com and save it on an excel file. 2. Use a separate tab to save the market adjusted prices of five stocks and the index. For each stock, compute the price changes using the current week prices minus the previous week prices. Create a new column for each stock which takes the value of one if the price changes are positive, zero otherwise. 3. Use a separate tab to stack up all information of price changes (1/0), ticker, and industry. This table should include three columns (stock's ticker, price changes, industry). Create pivot table to get the price change information across stocks and industry. 4. For each stock, create the probability tree to examine the stock movement relationship with the market. Compute the probability the stock up-price and the probability the stock up-price given the market up-price. Identify if the stock price change is independent of the market price change. 1. Choose five stocks of your selection from two industries. Download the historical data of weekly stock prices and S\&P 500 index prices from year 2017-2019 on the website of finance.yahoo.com and save it on an excel file. 2. Use a separate tab to save the market adjusted prices of five stocks and the index. For each stock, compute the price changes using the current week prices minus the previous week prices. Create a new column for each stock which takes the value of one if the price changes are positive, zero otherwise. 3. Use a separate tab to stack up all information of price changes (1/0), ticker, and industry. This table should include three columns (stock's ticker, price changes, industry). Create pivot table to get the price change information across stocks and industry. 4. For each stock, create the probability tree to examine the stock movement relationship with the market. Compute the probability the stock up-price and the probability the stock up-price given the market up-price. Identify if the stock price change is independent of the market price change
Step by Step Solution
There are 3 Steps involved in it

Get step-by-step solutions from verified subject matter experts