

Question: please help (b) A certain company makes and sells a number of products, including two called Prod1 and Prod2. The following table shows for each
please help
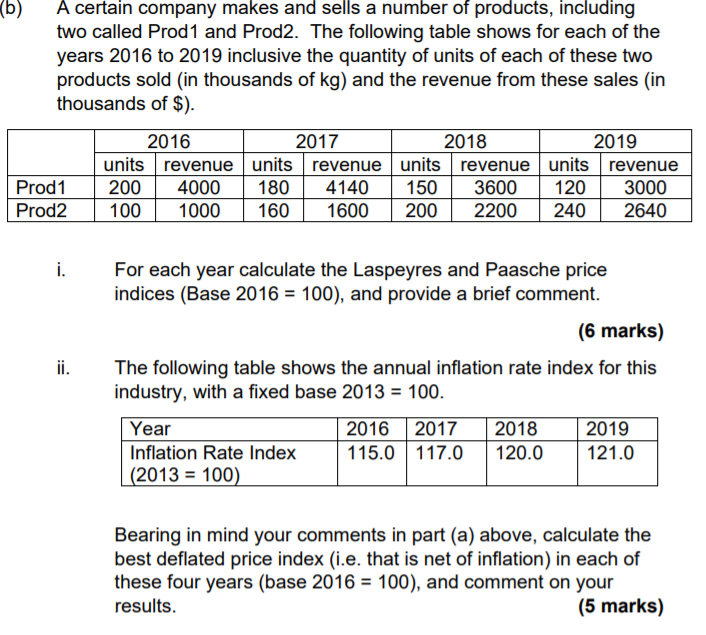
(b) A certain company makes and sells a number of products, including two called Prod1 and Prod2. The following table shows for each of the years 2016 to 2019 inclusive the quantity of units of each of these two products sold (in thousands of kg) and the revenue from these sales (in thousands of $). 2016 2017 2018 2019 units revenue units revenue units revenue units revenue Prod1 200 4000 180 4140 150 3600 120 3000 Prod2 100 1000 160 1600 200 2200 240 2640 For each year calculate the Laspeyres and Paasche price indices (Base 2016 = 100), and provide a brief comment. (6 marks) ii. The following table shows the annual inflation rate index for this industry, with a fixed base 2013 = 100. Year 2016 2017 2018 2019 Inflation Rate Index 115.0 117.0 120.0 121.0 (2013 = 100) Bearing in mind your comments in part (a) above, calculate the best deflated price index (i.e. that is net of inflation) in each of these four years (base 2016 = 100), and comment on your results
Step by Step Solution
There are 3 Steps involved in it

Get step-by-step solutions from verified subject matter experts