

Question: PLEASE HELP BY SOLVING THE FOLLOWING EQUATIONS: Starbucks Corp. (NMS: SBUX) Powered by Clearbit Exchange rate used is that of the Year End reported date
 PLEASE HELP BY SOLVING THE FOLLOWING EQUATIONS:
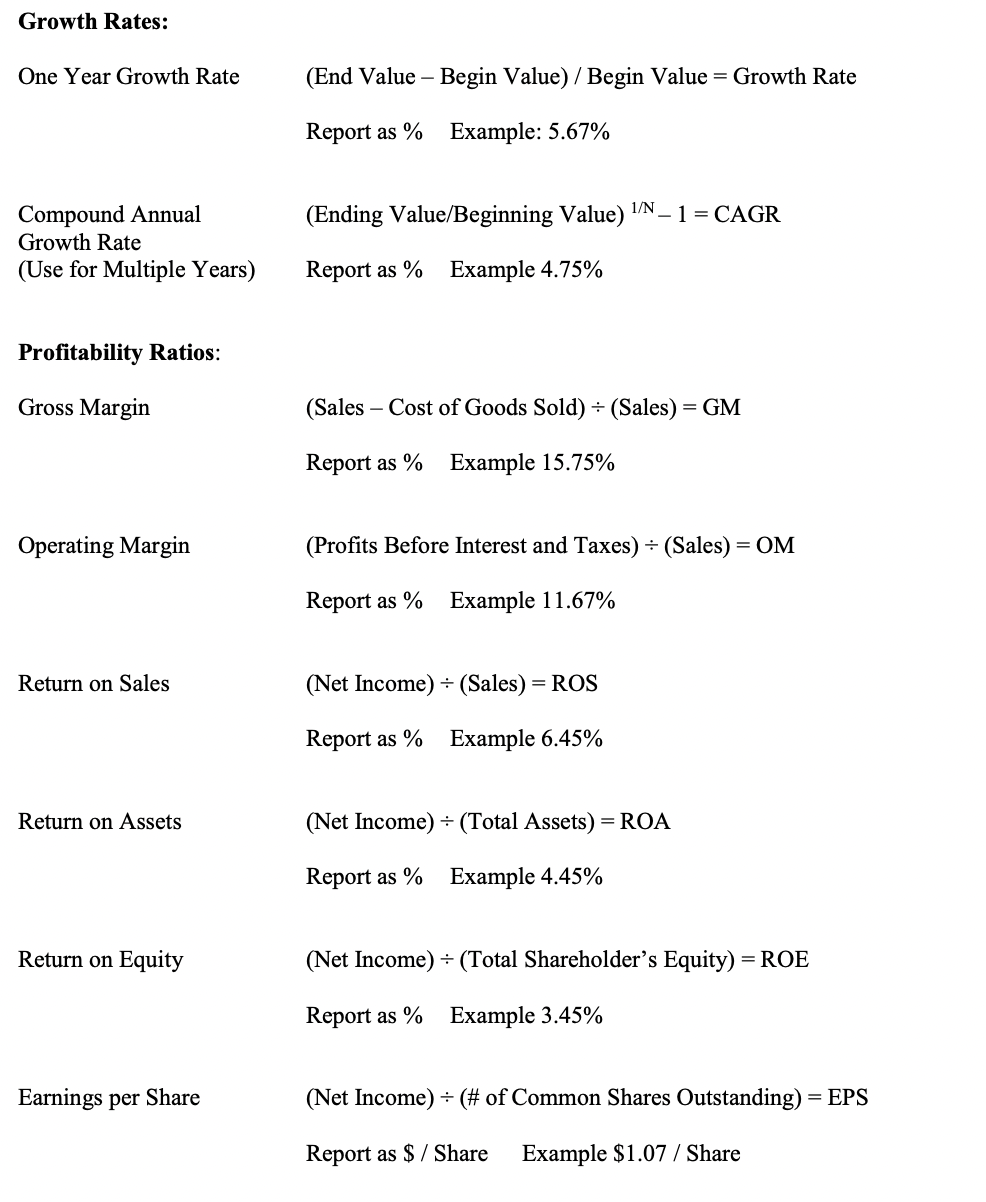
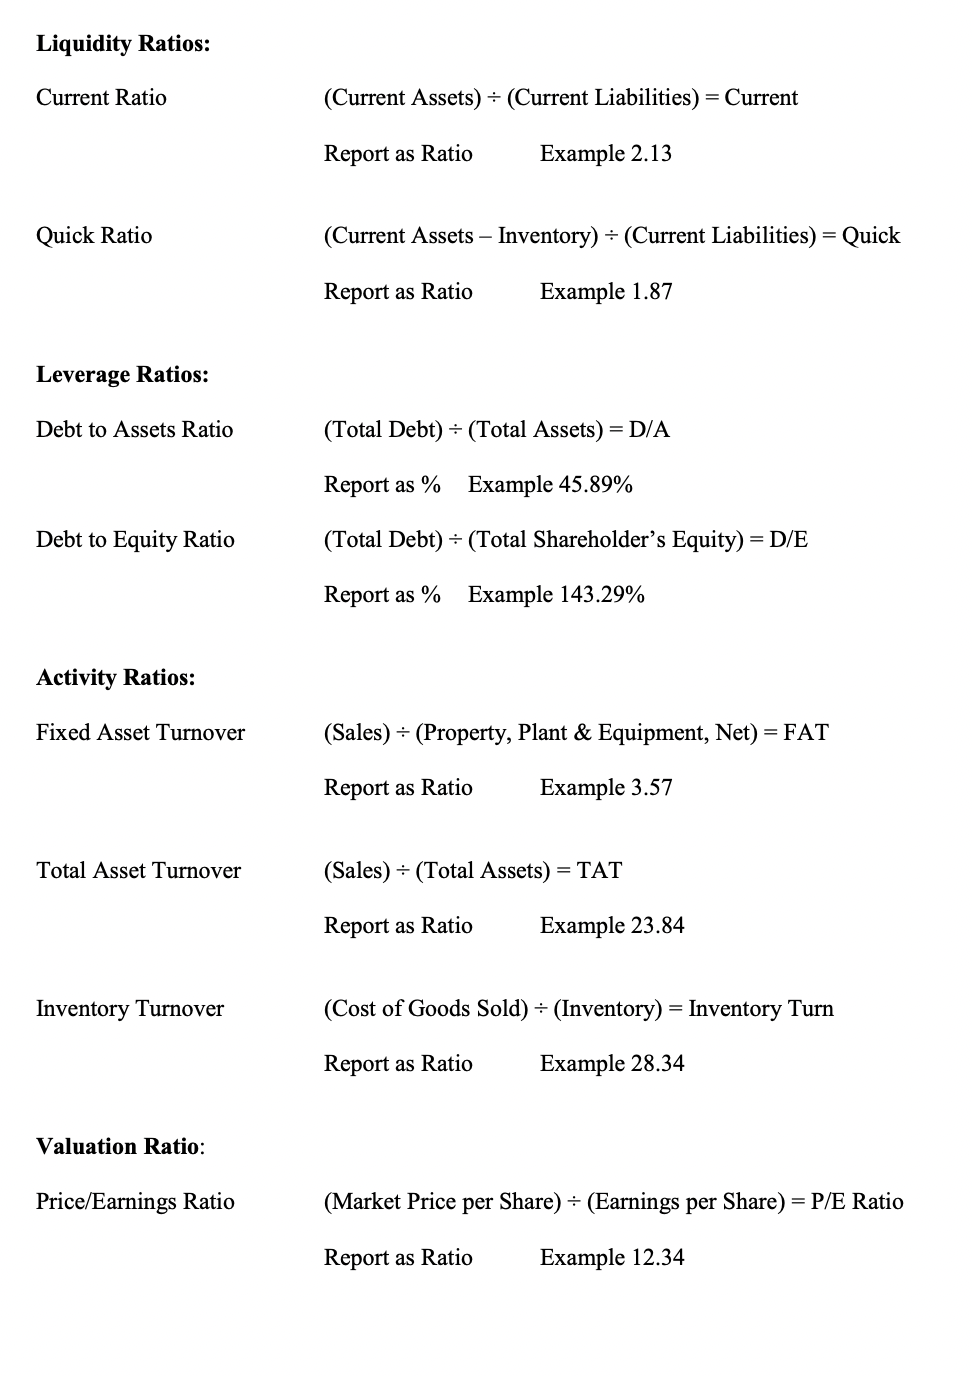
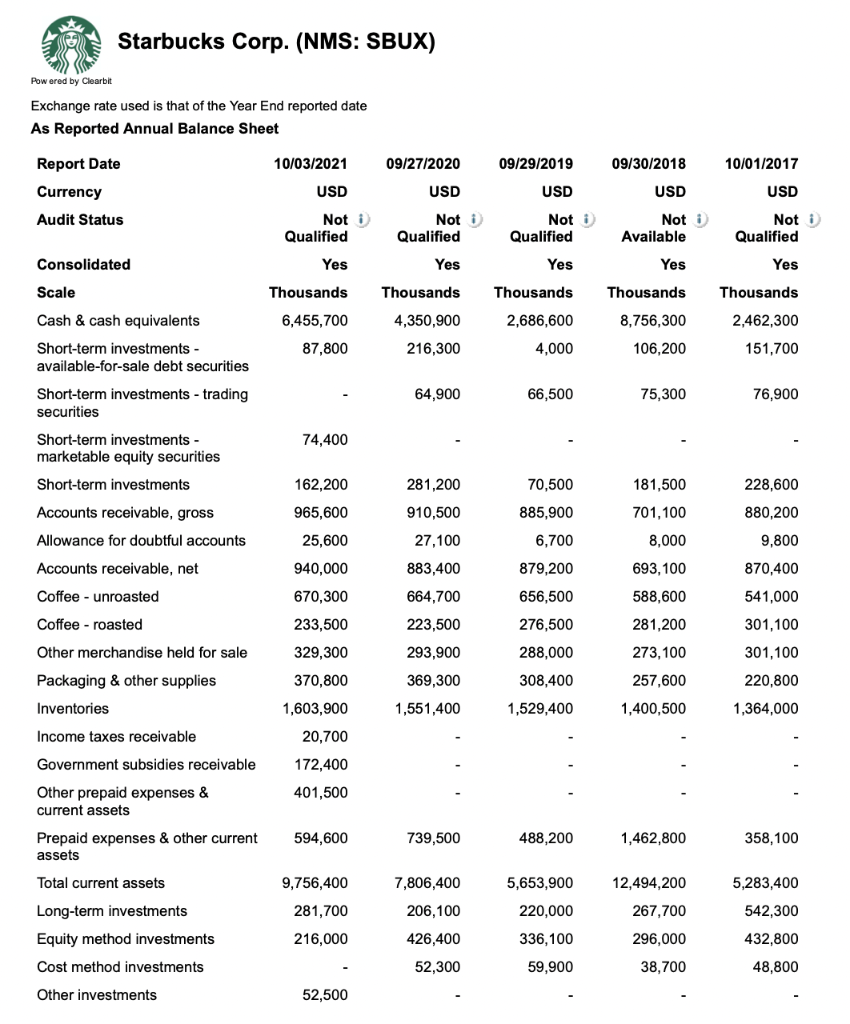
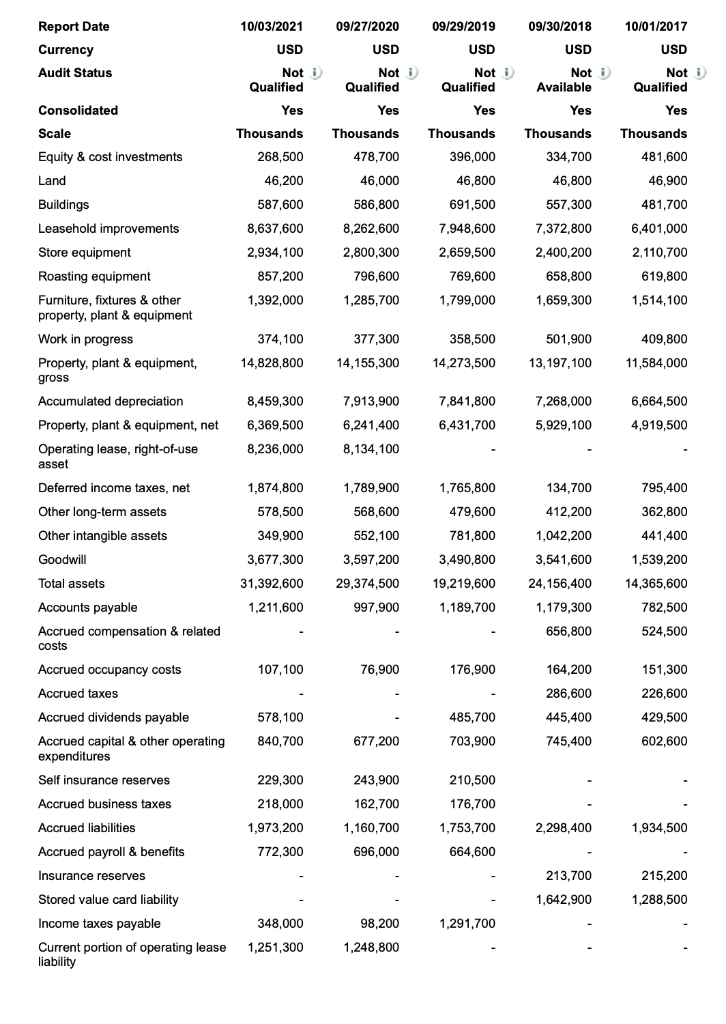
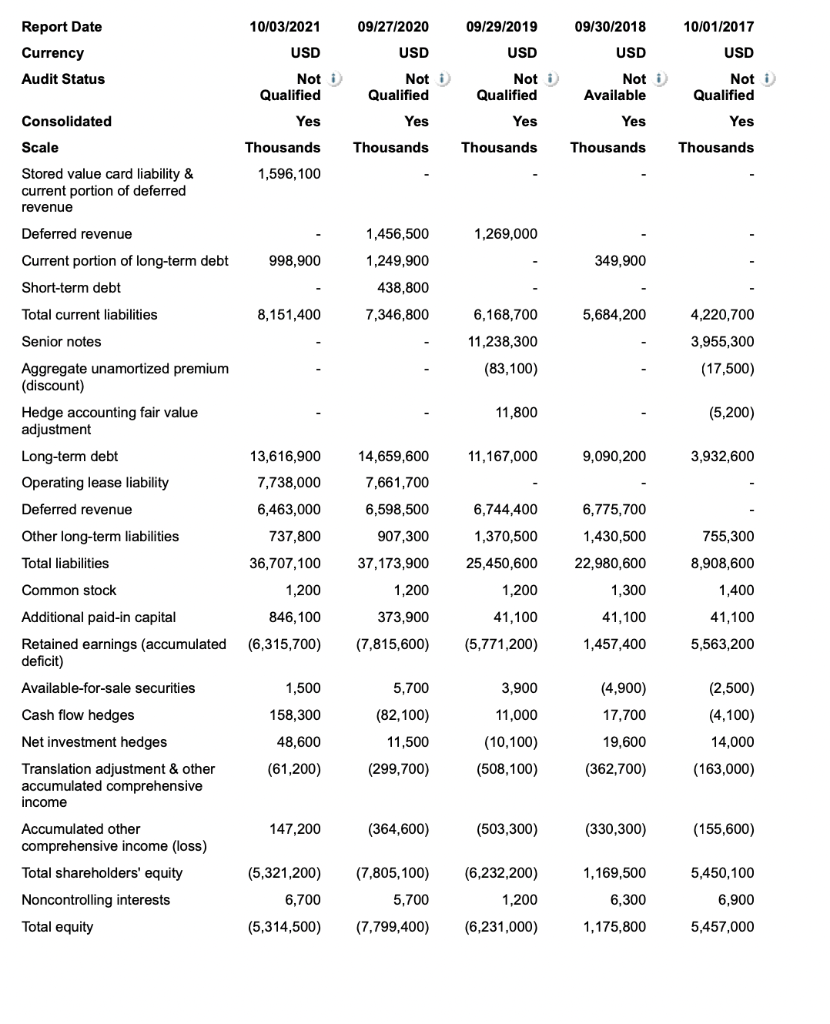
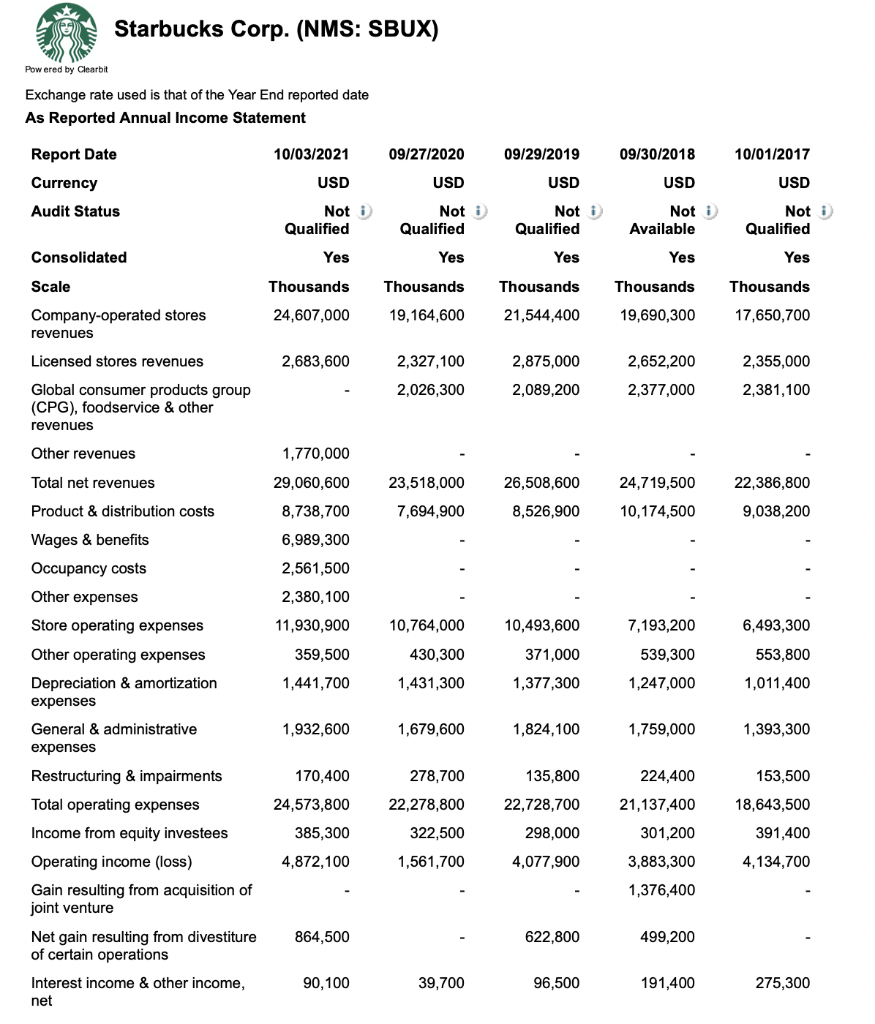
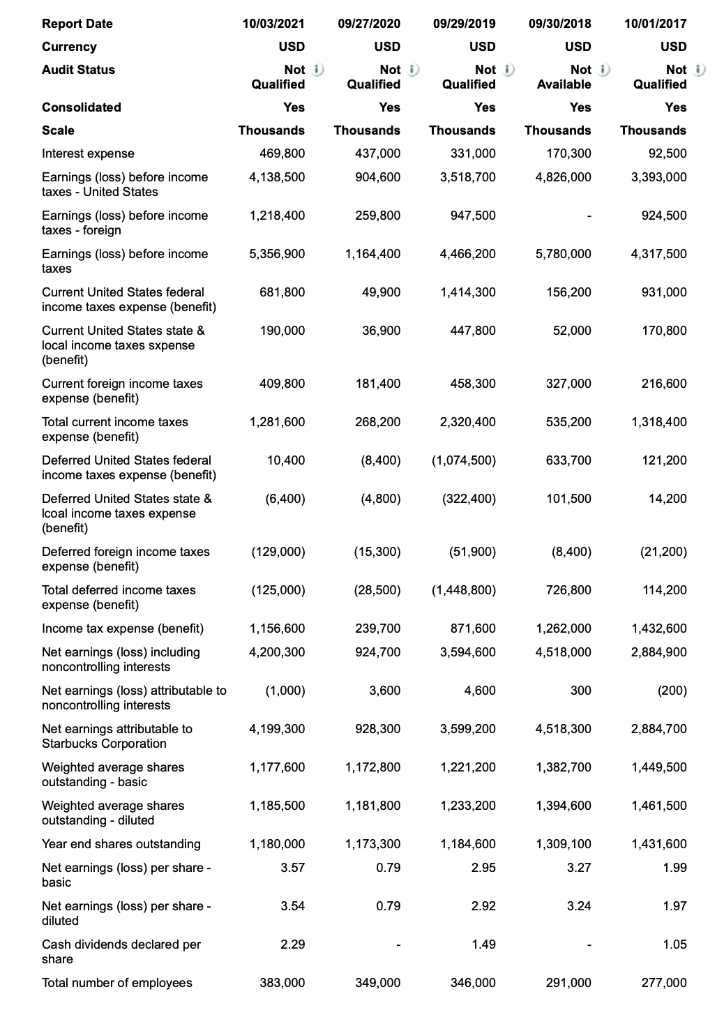
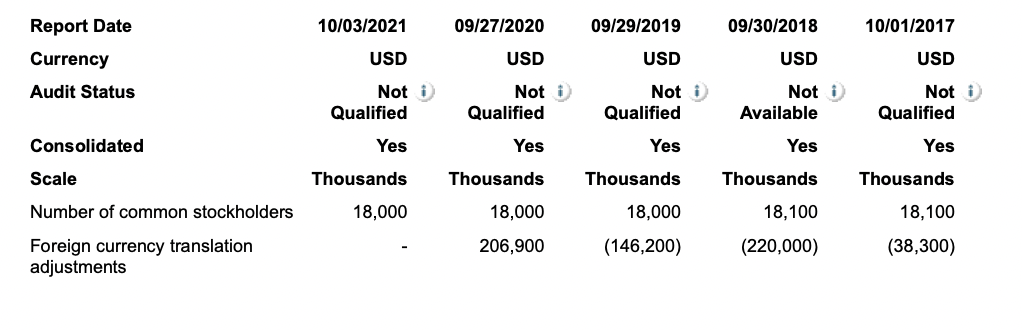
Starbucks Corp. (NMS: SBUX) Powered by Clearbit Exchange rate used is that of the Year End reported date As Reported Annual Balance Sheet 10/03/2021 09/27/2020 09/29/2019 09/30/2018 10/01/2017 Report Date Currency USD USD USD USD USD Audit Status Not 1) Qualified Not i Qualified Not i Qualified Yes Not i Available Not i Qualified Consolidated Yes Yes Yes Scale Thousands Yes Thousands 4,350,900 Thousands Thousands Thousands 6,455,700 2,686,600 8,756,300 2,462,300 87,800 216,300 4,000 106,200 151,700 Cash & cash equivalents Short-term investments - available-for-sale debt securities Short-term investments - trading securities 64,900 66,500 75,300 76,900 74,400 Short-term investments - marketable equity securities Short-term investments 162,200 281,200 70,500 885,900 Accounts receivable, gross 965,600 25,600 910,500 27,100 181,500 701,100 8,000 228,600 880,200 9,800 6,700 Allowance for doubtful accounts Accounts receivable, net 940,000 879,200 870,400 883,400 664,700 Coffee - unroasted 670,300 693,100 588,600 281,200 541,000 Coffee - roasted 223,500 656,500 276,500 288,000 233,500 329,300 301,100 Other merchandise held for sale 293,900 273,100 369,300 308,400 257,600 370,800 1,603,900 301,100 220,800 1,364,000 1,551,400 1,529,400 1,400,500 20,700 Packaging & other supplies Inventories Income taxes receivable Government subsidies receivable Other prepaid expenses & current assets 172,400 401,500 594,600 739,500 488,200 1,462,800 358,100 Prepaid expenses & other current assets Total current assets 7,806,400 5,653,900 12,494,200 5,283,400 9,756,400 281,700 206,100 220,000 267,700 542,300 Long-term investments Equity method investments 216,000 426,400 336,100 296,000 432,800 Cost method investments 52,300 59,900 38,700 48,800 Other investments 52,500 10/03/2021 09/27/2020 09/29/2019 Report Date Currency Audit Status USD USD USD Not i Qualified Yes Thousands Consolidated Scale Not : Qualified Yes Thousands 396,000 09/30/2018 USD Not i Available Yes Thousands 334,700 46.800 557,300 7,372,800 2,400,200 Not i Qualified Yes Thousands 268,500 46,200 587,600 8,637,600 2,934,100 857,200 10/01/2017 USD Not i Qualified Yes Thousands 481,600 46,900 481,700 478,700 Equity & cost investments Land Buildings Leasehold improvements 46,800 46,000 586,800 691,500 8,262,600 7,948,600 2,659,500 Store equipment 2,800,300 796,600 6,401,000 2,110,700 619,800 658,800 Roasting equipment Furniture, fixtures & other property, plant & equipment 769,600 1,799,000 1,392,000 1,285,700 1,659,300 1,514,100 Work in progress 374,100 377,300 501,900 409,800 358,500 14,273,500 14,828,800 14,155,300 13,197,100 11,584,000 7,913,900 7,841,800 8,459,300 6,369,500 8,236,000 7,268,000 5,929, 100 6,664,500 4,919,500 6,241,400 6,431,700 8,134,100 Property, plant & equipment, gross Accumulated depreciation Property, plant & equipment, net Operating lease, right-of-use asset Deferred income taxes, net , Other long-term assets Other intangible assets Goodwill 1,874,800 1,789,900 1,765,800 795,400 362,800 578,500 568,600 552,100 3,597,200 479,600 781,800 349,900 134,700 412,200 1,042,200 3,541.600 24,156,400 441,400 3,677,300 3.490,800 1,539,200 Total assets 31,392,600 19,219,600 29,374,500 997,900 14,365,600 782,500 1,211,600 1,189,700 1,179,300 656,800 524,500 107,100 76,900 176,900 164,200 151,300 578,100 485,700 703,900 286,600 445,400 745,400 226,600 429,500 602,600 840,700 677,200 Accounts payable Accrued compensation & related costs Accrued occupancy costs Accrued taxes Accrued dividends payable Accrued capital & other operating expenditures Self insurance reserves Accrued business taxes Accrued liabilities Accrued payroll & benefits Insurance reserves Stored value card liability Income taxes payable Current portion of operating lease liability 229,300 218,000 1,973,200 772,300 243,900 162,700 1,160,700 696,000 210,500 176,700 1,753,700 664,600 2,298,400 1,934,500 213,700 1,642,900 215,200 1,288,500 348,000 98,200 1,291,700 1,251,300 1,248,800 10/03/2021 09/27/2020 09/29/2019 09/30/2018 10/01/2017 Report Date Currency USD USD USD USD USD Audit Status Not : Qualified Not 1 Qualified Not i Qualified Not i Available Not 1 Qualified Yes Consolidated Yes Yes Yes Yes Scale Thousands Thousands Thousands Thousands Thousands 1,596,100 Stored value card liability & current portion of deferred revenue Deferred revenue 1,456,500 1,269,000 998,900 1,249,900 349,900 Current portion of long-term debt Short-term debt Total current liabilities 438,800 8,151,400 7,346,800 5,684,200 4,220,700 Senior notes 6,168,700 11,238,300 (83,100) 3,955,300 (17,500) 11,800 (5,200) Aggregate unamortized premium (discount) Hedge accounting fair value adjustment Long-term debt Operating lease liability Deferred revenue Other long-term liabilities 14,659,600 11,167,000 9,090,200 3,932,600 13,616,900 7,738,000 6,463,000 7,661,700 6,598,500 6,744,400 6,775,700 1,430,500 755,300 Total liabilities 737,800 36,707,100 1,200 907,300 37,173,900 1,200 22,980,600 8,908,600 Common stock 1,370,500 25,450,600 1,200 41,100 (5,771,200) 1,300 1,400 846,100 41,100 41,100 373,900 (7,815,600) (6,315,700) 1,457,400 5,563,200 1,500 5,700 3,900 Additional paid-in capital Retained earnings (accumulated deficit) Available-for-sale securities Cash flow hedges Net investment hedges Translation adjustment & other accumulated comprehensive income (4,900) 17,700 11,000 158,300 48,600 (61,200) (82,100) 11,500 (2,500) (4,100) 14,000 19,600 (10,100) (508,100) (299,700) (362,700) (163,000) 147,200 (364,600) (503,300) (330,300) (155,600) Accumulated other comprehensive income (loss) Total shareholders' equity Noncontrolling interests 1,169,500 5,450,100 (5,321,200) 6,700 (7,805,100) 5,700 (6,232,200) 1,200 6,300 6,900 Total equity (5,314,500) (7,799,400) (6,231,000) 1,175,800 5,457,000 Starbucks Corp. (NMS: SBUX) Powered by Clearbit Exchange rate used is that of the Year End reported date As Reported Annual Income Statement 10/03/2021 09/27/2020 09/29/2019 09/30/2018 10/01/2017 Report Date Currency Audit Status USD USD USD USD USD Not i Qualified Not i Qualified Not i Qualified Not i Available Not i Qualified Consolidated Yes Yes Yes Yes Yes Scale Thousands Thousands Thousands Thousands Thousands 24,607,000 19,164,600 21,544,400 19,690,300 Company-operated stores revenues 17,650,700 Licensed stores revenues 2,683,600 2,327,100 2,875,000 2,652,200 2,355,000 2,026,300 2,089,200 2,377,000 2,381,100 Global consumer products group (CPG), foodservice & other revenues Other revenues 1,770,000 Total net revenues 23,518,000 26,508,600 24,719,500 22,386,800 29,060,600 8,738,700 Product & distribution costs 7,694,900 8,526,900 10,174,500 9,038,200 Wages & benefits Occupancy costs 6,989,300 2,561,500 Other expenses 2,380,100 11,930,900 10,764,000 10,493,600 7,193,200 6,493,300 359,500 430,300 371,000 539,300 553,800 1,441,700 1,431,300 1,377,300 1,247,000 1,011,400 1,932,600 1,679,600 1,824,100 1,759,000 1,393,300 278,700 135,800 Store operating expenses Other operating expenses Depreciation & amortization expenses General & administrative expenses Restructuring & impairments Total operating expenses Income from equity investees Operating income (loss) Gain resulting from acquisition of joint venture Net gain resulting from divestiture of certain operations Interest income & other income, net 170,400 24,573,800 22,278,800 22,728,700 224,400 21,137,400 301,200 153,500 18,643,500 391,400 385,300 322,500 298,000 4,872,100 1,561,700 4,077,900 3,883,300 4,134,700 1,376,400 864,500 622,800 499,200 90,100 39,700 96,500 191,400 275,300 09/27/2020 Report Date Currency Audit Status 10/03/2021 USD 09/29/2019 USD 10/01/2017 USD USD 09/30/2018 USD Not Available Not i Qualified Not Qualified Yes Not Qualified Consolidated Yes Yes Yes Thousands 469,800 4,138,500 Thousands 437,000 904,600 Thousands 331,000 3,518,700 Thousands 170,300 4,826,000 Not 1) Qualified Yes Thousands 92,500 3,393,000 Scale Interest expense Earnings (loss) before income taxes - United States Earnings (loss) before income taxes - foreign Earnings (loss) before income taxes 1,218,400 259,800 947,500 924,500 5,356,900 1,164,400 4,466,200 5,780,000 4,317,500 681,800 49,900 1,414,300 156,200 931,000 190,000 36,900 447,800 52,000 170,800 409,800 181,400 458,300 327,000 216,600 1,281,600 268,200 2,320,400 535,200 1,318,400 10,400 (8,400) (1,074,500) 633,700 121,200 (6,400) (4,800) (322,400) 101,500 14,200 (129,000) (15,300) (51,900) (8,400) (21,200) Current United States federal income taxes expense (benefit) Current United States state & & local income taxes sxpense (benefit) Current foreign income taxes expense (benefit) Total current income taxes expense (benefit) Deferred United States federal income taxes expense (benefit) Deferred United States state & Icoal income taxes expense (benefit) Deferred foreign income taxes expense (benefit) Total deferred income taxes expense (benefit) Income tax expense (benefit) Net earnings (loss) including noncontrolling interests Net earnings (loss) attributable to noncontrolling interests Net earnings attributable to Starbucks Corporation Weighted average shares outstanding - basic Weighted average shares outstanding - diluted Year end shares outstanding Net earnings (loss) per share - basic (125,000) (28,500) (1,448,800) 726.800 114,200 1,156,600 239,700 924,700 871,600 3,594,600 1,262,000 4,518,000 1,432,600 2,884,900 4,200,300 (1,000) 3,600 4,600 300 (200) 4,199,300 928,300 3,599,200 4,518,300 2,884,700 1,177,600 1,172,800 1,221,200 1,382,700 1,449,500 1,185,500 1,181,800 1,233,200 1,394,600 1,461,500 1,180,000 1,173,300 1,184,600 1,309,100 1,431,600 1.99 3.57 0.79 2.95 3.27 3.54 0.79 2.92 3.24 1.97 Net earnings (loss) per share - diluted 2.29 1.49 1.05 Cash dividends declared per share Total number of employees 383,000 349,000 346,000 291,000 277,000 10/03/2021 09/27/2020 09/29/2019 09/30/2018 10/01/2017 Report Date Currency Audit Status USD USD USD USD USD Not i Qualified Not i Qualified Not i Qualified Not i Available Not i Qualified Consolidated Yes Yes Yes Yes Yes Scale Thousands Thousands Thousands Thousands Thousands Number of common stockholders 18,000 18,000 18,000 18,100 18,100 (220,000) 206,900 Foreign currency translation adjustments (146,200) (38,300) Growth Rates: One Year Growth Rate (End Value - Begin Value) / Begin Value = Growth Rate Report as % Example: 5.67% 1/N (Ending Value/Beginning Value) - 1 = CAGR Compound Annual Growth Rate (Use for Multiple Years) Report as % Example 4.75% Profitability Ratios: Gross Margin (Sales - Cost of Goods Sold) = (Sales) = GM Report as % Example 15.75% Operating Margin (Profits Before Interest and Taxes) = (Sales) = OM = Report as % Example 11.67% Return on Sales (Net Income) = (Sales) = ROS Report as % Example 6.45% Return on Assets (Net Income) = (Total Assets) = ROA Report as % Example 4.45% Return on Equity (Net Income) = (Total Shareholder's Equity) = ROE Report as % Example 3.45% Earnings per Share (Net Income) = (# of Common Shares Outstanding) = EPS = Report as $ / Share Example $1.07 / Share Liquidity Ratios: Current Ratio (Current Assets) = (Current Liabilities) = Current = Report as Ratio Example 2.13 Quick Ratio (Current Assets Inventory) = (Current Liabilities) = Quick Report as Ratio Example 1.87 Leverage Ratios: Debt to Assets Ratio (Total Debt) = (Total Assets) = D/A Report as % Example 45.89% Debt to Equity Ratio (Total Debt) = (Total Shareholder's Equity) = D/E = Report as % Example 143.29% Activity Ratios: Fixed Asset Turnover (Sales) = (Property, Plant & Equipment, Net) = FAT Report as Ratio Example 3.57 Total Asset Turnover (Sales) = (Total Assets) = TAT = Report as Ratio Example 23.84 Inventory Turnover (Cost of Goods Sold) = (Inventory) = Inventory Turn = Report as Ratio Example 28.34 Valuation Ratio: Price/Earnings Ratio (Market Price per Share) -- (Earnings per Share) = P/E Ratio = Report as Ratio Example 12.34 Starbucks Corp. (NMS: SBUX) Powered by Clearbit Exchange rate used is that of the Year End reported date As Reported Annual Balance Sheet 10/03/2021 09/27/2020 09/29/2019 09/30/2018 10/01/2017 Report Date Currency USD USD USD USD USD Audit Status Not 1) Qualified Not i Qualified Not i Qualified Yes Not i Available Not i Qualified Consolidated Yes Yes Yes Scale Thousands Yes Thousands 4,350,900 Thousands Thousands Thousands 6,455,700 2,686,600 8,756,300 2,462,300 87,800 216,300 4,000 106,200 151,700 Cash & cash equivalents Short-term investments - available-for-sale debt securities Short-term investments - trading securities 64,900 66,500 75,300 76,900 74,400 Short-term investments - marketable equity securities Short-term investments 162,200 281,200 70,500 885,900 Accounts receivable, gross 965,600 25,600 910,500 27,100 181,500 701,100 8,000 228,600 880,200 9,800 6,700 Allowance for doubtful accounts Accounts receivable, net 940,000 879,200 870,400 883,400 664,700 Coffee - unroasted 670,300 693,100 588,600 281,200 541,000 Coffee - roasted 223,500 656,500 276,500 288,000 233,500 329,300 301,100 Other merchandise held for sale 293,900 273,100 369,300 308,400 257,600 370,800 1,603,900 301,100 220,800 1,364,000 1,551,400 1,529,400 1,400,500 20,700 Packaging & other supplies Inventories Income taxes receivable Government subsidies receivable Other prepaid expenses & current assets 172,400 401,500 594,600 739,500 488,200 1,462,800 358,100 Prepaid expenses & other current assets Total current assets 7,806,400 5,653,900 12,494,200 5,283,400 9,756,400 281,700 206,100 220,000 267,700 542,300 Long-term investments Equity method investments 216,000 426,400 336,100 296,000 432,800 Cost method investments 52,300 59,900 38,700 48,800 Other investments 52,500 10/03/2021 09/27/2020 09/29/2019 Report Date Currency Audit Status USD USD USD Not i Qualified Yes Thousands Consolidated Scale Not : Qualified Yes Thousands 396,000 09/30/2018 USD Not i Available Yes Thousands 334,700 46.800 557,300 7,372,800 2,400,200 Not i Qualified Yes Thousands 268,500 46,200 587,600 8,637,600 2,934,100 857,200 10/01/2017 USD Not i Qualified Yes Thousands 481,600 46,900 481,700 478,700 Equity & cost investments Land Buildings Leasehold improvements 46,800 46,000 586,800 691,500 8,262,600 7,948,600 2,659,500 Store equipment 2,800,300 796,600 6,401,000 2,110,700 619,800 658,800 Roasting equipment Furniture, fixtures & other property, plant & equipment 769,600 1,799,000 1,392,000 1,285,700 1,659,300 1,514,100 Work in progress 374,100 377,300 501,900 409,800 358,500 14,273,500 14,828,800 14,155,300 13,197,100 11,584,000 7,913,900 7,841,800 8,459,300 6,369,500 8,236,000 7,268,000 5,929, 100 6,664,500 4,919,500 6,241,400 6,431,700 8,134,100 Property, plant & equipment, gross Accumulated depreciation Property, plant & equipment, net Operating lease, right-of-use asset Deferred income taxes, net , Other long-term assets Other intangible assets Goodwill 1,874,800 1,789,900 1,765,800 795,400 362,800 578,500 568,600 552,100 3,597,200 479,600 781,800 349,900 134,700 412,200 1,042,200 3,541.600 24,156,400 441,400 3,677,300 3.490,800 1,539,200 Total assets 31,392,600 19,219,600 29,374,500 997,900 14,365,600 782,500 1,211,600 1,189,700 1,179,300 656,800 524,500 107,100 76,900 176,900 164,200 151,300 578,100 485,700 703,900 286,600 445,400 745,400 226,600 429,500 602,600 840,700 677,200 Accounts payable Accrued compensation & related costs Accrued occupancy costs Accrued taxes Accrued dividends payable Accrued capital & other operating expenditures Self insurance reserves Accrued business taxes Accrued liabilities Accrued payroll & benefits Insurance reserves Stored value card liability Income taxes payable Current portion of operating lease liability 229,300 218,000 1,973,200 772,300 243,900 162,700 1,160,700 696,000 210,500 176,700 1,753,700 664,600 2,298,400 1,934,500 213,700 1,642,900 215,200 1,288,500 348,000 98,200 1,291,700 1,251,300 1,248,800 10/03/2021 09/27/2020 09/29/2019 09/30/2018 10/01/2017 Report Date Currency USD USD USD USD USD Audit Status Not : Qualified Not 1 Qualified Not i Qualified Not i Available Not 1 Qualified Yes Consolidated Yes Yes Yes Yes Scale Thousands Thousands Thousands Thousands Thousands 1,596,100 Stored value card liability & current portion of deferred revenue Deferred revenue 1,456,500 1,269,000 998,900 1,249,900 349,900 Current portion of long-term debt Short-term debt Total current liabilities 438,800 8,151,400 7,346,800 5,684,200 4,220,700 Senior notes 6,168,700 11,238,300 (83,100) 3,955,300 (17,500) 11,800 (5,200) Aggregate unamortized premium (discount) Hedge accounting fair value adjustment Long-term debt Operating lease liability Deferred revenue Other long-term liabilities 14,659,600 11,167,000 9,090,200 3,932,600 13,616,900 7,738,000 6,463,000 7,661,700 6,598,500 6,744,400 6,775,700 1,430,500 755,300 Total liabilities 737,800 36,707,100 1,200 907,300 37,173,900 1,200 22,980,600 8,908,600 Common stock 1,370,500 25,450,600 1,200 41,100 (5,771,200) 1,300 1,400 846,100 41,100 41,100 373,900 (7,815,600) (6,315,700) 1,457,400 5,563,200 1,500 5,700 3,900 Additional paid-in capital Retained earnings (accumulated deficit) Available-for-sale securities Cash flow hedges Net investment hedges Translation adjustment & other accumulated comprehensive income (4,900) 17,700 11,000 158,300 48,600 (61,200) (82,100) 11,500 (2,500) (4,100) 14,000 19,600 (10,100) (508,100) (299,700) (362,700) (163,000) 147,200 (364,600) (503,300) (330,300) (155,600) Accumulated other comprehensive income (loss) Total shareholders' equity Noncontrolling interests 1,169,500 5,450,100 (5,321,200) 6,700 (7,805,100) 5,700 (6,232,200) 1,200 6,300 6,900 Total equity (5,314,500) (7,799,400) (6,231,000) 1,175,800 5,457,000 Starbucks Corp. (NMS: SBUX) Powered by Clearbit Exchange rate used is that of the Year End reported date As Reported Annual Income Statement 10/03/2021 09/27/2020 09/29/2019 09/30/2018 10/01/2017 Report Date Currency Audit Status USD USD USD USD USD Not i Qualified Not i Qualified Not i Qualified Not i Available Not i Qualified Consolidated Yes Yes Yes Yes Yes Scale Thousands Thousands Thousands Thousands Thousands 24,607,000 19,164,600 21,544,400 19,690,300 Company-operated stores revenues 17,650,700 Licensed stores revenues 2,683,600 2,327,100 2,875,000 2,652,200 2,355,000 2,026,300 2,089,200 2,377,000 2,381,100 Global consumer products group (CPG), foodservice & other revenues Other revenues 1,770,000 Total net revenues 23,518,000 26,508,600 24,719,500 22,386,800 29,060,600 8,738,700 Product & distribution costs 7,694,900 8,526,900 10,174,500 9,038,200 Wages & benefits Occupancy costs 6,989,300 2,561,500 Other expenses 2,380,100 11,930,900 10,764,000 10,493,600 7,193,200 6,493,300 359,500 430,300 371,000 539,300 553,800 1,441,700 1,431,300 1,377,300 1,247,000 1,011,400 1,932,600 1,679,600 1,824,100 1,759,000 1,393,300 278,700 135,800 Store operating expenses Other operating expenses Depreciation & amortization expenses General & administrative expenses Restructuring & impairments Total operating expenses Income from equity investees Operating income (loss) Gain resulting from acquisition of joint venture Net gain resulting from divestiture of certain operations Interest income & other income, net 170,400 24,573,800 22,278,800 22,728,700 224,400 21,137,400 301,200 153,500 18,643,500 391,400 385,300 322,500 298,000 4,872,100 1,561,700 4,077,900 3,883,300 4,134,700 1,376,400 864,500 622,800 499,200 90,100 39,700 96,500 191,400 275,300 09/27/2020 Report Date Currency Audit Status 10/03/2021 USD 09/29/2019 USD 10/01/2017 USD USD 09/30/2018 USD Not Available Not i Qualified Not Qualified Yes Not Qualified Consolidated Yes Yes Yes Thousands 469,800 4,138,500 Thousands 437,000 904,600 Thousands 331,000 3,518,700 Thousands 170,300 4,826,000 Not 1) Qualified Yes Thousands 92,500 3,393,000 Scale Interest expense Earnings (loss) before income taxes - United States Earnings (loss) before income taxes - foreign Earnings (loss) before income taxes 1,218,400 259,800 947,500 924,500 5,356,900 1,164,400 4,466,200 5,780,000 4,317,500 681,800 49,900 1,414,300 156,200 931,000 190,000 36,900 447,800 52,000 170,800 409,800 181,400 458,300 327,000 216,600 1,281,600 268,200 2,320,400 535,200 1,318,400 10,400 (8,400) (1,074,500) 633,700 121,200 (6,400) (4,800) (322,400) 101,500 14,200 (129,000) (15,300) (51,900) (8,400) (21,200) Current United States federal income taxes expense (benefit) Current United States state & & local income taxes sxpense (benefit) Current foreign income taxes expense (benefit) Total current income taxes expense (benefit) Deferred United States federal income taxes expense (benefit) Deferred United States state & Icoal income taxes expense (benefit) Deferred foreign income taxes expense (benefit) Total deferred income taxes expense (benefit) Income tax expense (benefit) Net earnings (loss) including noncontrolling interests Net earnings (loss) attributable to noncontrolling interests Net earnings attributable to Starbucks Corporation Weighted average shares outstanding - basic Weighted average shares outstanding - diluted Year end shares outstanding Net earnings (loss) per share - basic (125,000) (28,500) (1,448,800) 726.800 114,200 1,156,600 239,700 924,700 871,600 3,594,600 1,262,000 4,518,000 1,432,600 2,884,900 4,200,300 (1,000) 3,600 4,600 300 (200) 4,199,300 928,300 3,599,200 4,518,300 2,884,700 1,177,600 1,172,800 1,221,200 1,382,700 1,449,500 1,185,500 1,181,800 1,233,200 1,394,600 1,461,500 1,180,000 1,173,300 1,184,600 1,309,100 1,431,600 1.99 3.57 0.79 2.95 3.27 3.54 0.79 2.92 3.24 1.97 Net earnings (loss) per share - diluted 2.29 1.49 1.05 Cash dividends declared per share Total number of employees 383,000 349,000 346,000 291,000 277,000 10/03/2021 09/27/2020 09/29/2019 09/30/2018 10/01/2017 Report Date Currency Audit Status USD USD USD USD USD Not i Qualified Not i Qualified Not i Qualified Not i Available Not i Qualified Consolidated Yes Yes Yes Yes Yes Scale Thousands Thousands Thousands Thousands Thousands Number of common stockholders 18,000 18,000 18,000 18,100 18,100 (220,000) 206,900 Foreign currency translation adjustments (146,200) (38,300) Growth Rates: One Year Growth Rate (End Value - Begin Value) / Begin Value = Growth Rate Report as % Example: 5.67% 1/N (Ending Value/Beginning Value) - 1 = CAGR Compound Annual Growth Rate (Use for Multiple Years) Report as % Example 4.75% Profitability Ratios: Gross Margin (Sales - Cost of Goods Sold) = (Sales) = GM Report as % Example 15.75% Operating Margin (Profits Before Interest and Taxes) = (Sales) = OM = Report as % Example 11.67% Return on Sales (Net Income) = (Sales) = ROS Report as % Example 6.45% Return on Assets (Net Income) = (Total Assets) = ROA Report as % Example 4.45% Return on Equity (Net Income) = (Total Shareholder's Equity) = ROE Report as % Example 3.45% Earnings per Share (Net Income) = (# of Common Shares Outstanding) = EPS = Report as $ / Share Example $1.07 / Share Liquidity Ratios: Current Ratio (Current Assets) = (Current Liabilities) = Current = Report as Ratio Example 2.13 Quick Ratio (Current Assets Inventory) = (Current Liabilities) = Quick Report as Ratio Example 1.87 Leverage Ratios: Debt to Assets Ratio (Total Debt) = (Total Assets) = D/A Report as % Example 45.89% Debt to Equity Ratio (Total Debt) = (Total Shareholder's Equity) = D/E = Report as % Example 143.29% Activity Ratios: Fixed Asset Turnover (Sales) = (Property, Plant & Equipment, Net) = FAT Report as Ratio Example 3.57 Total Asset Turnover (Sales) = (Total Assets) = TAT = Report as Ratio Example 23.84 Inventory Turnover (Cost of Goods Sold) = (Inventory) = Inventory Turn = Report as Ratio Example 28.34 Valuation Ratio: Price/Earnings Ratio (Market Price per Share) -- (Earnings per Share) = P/E Ratio = Report as Ratio Example 12.34
Step by Step Solution
There are 3 Steps involved in it

Get step-by-step solutions from verified subject matter experts