

Question: Please help (c) Rolling a 2 or an odd number 19. U.S. Age Distribution The estimated percent distribution of the U.S population for 2020 is
Please help
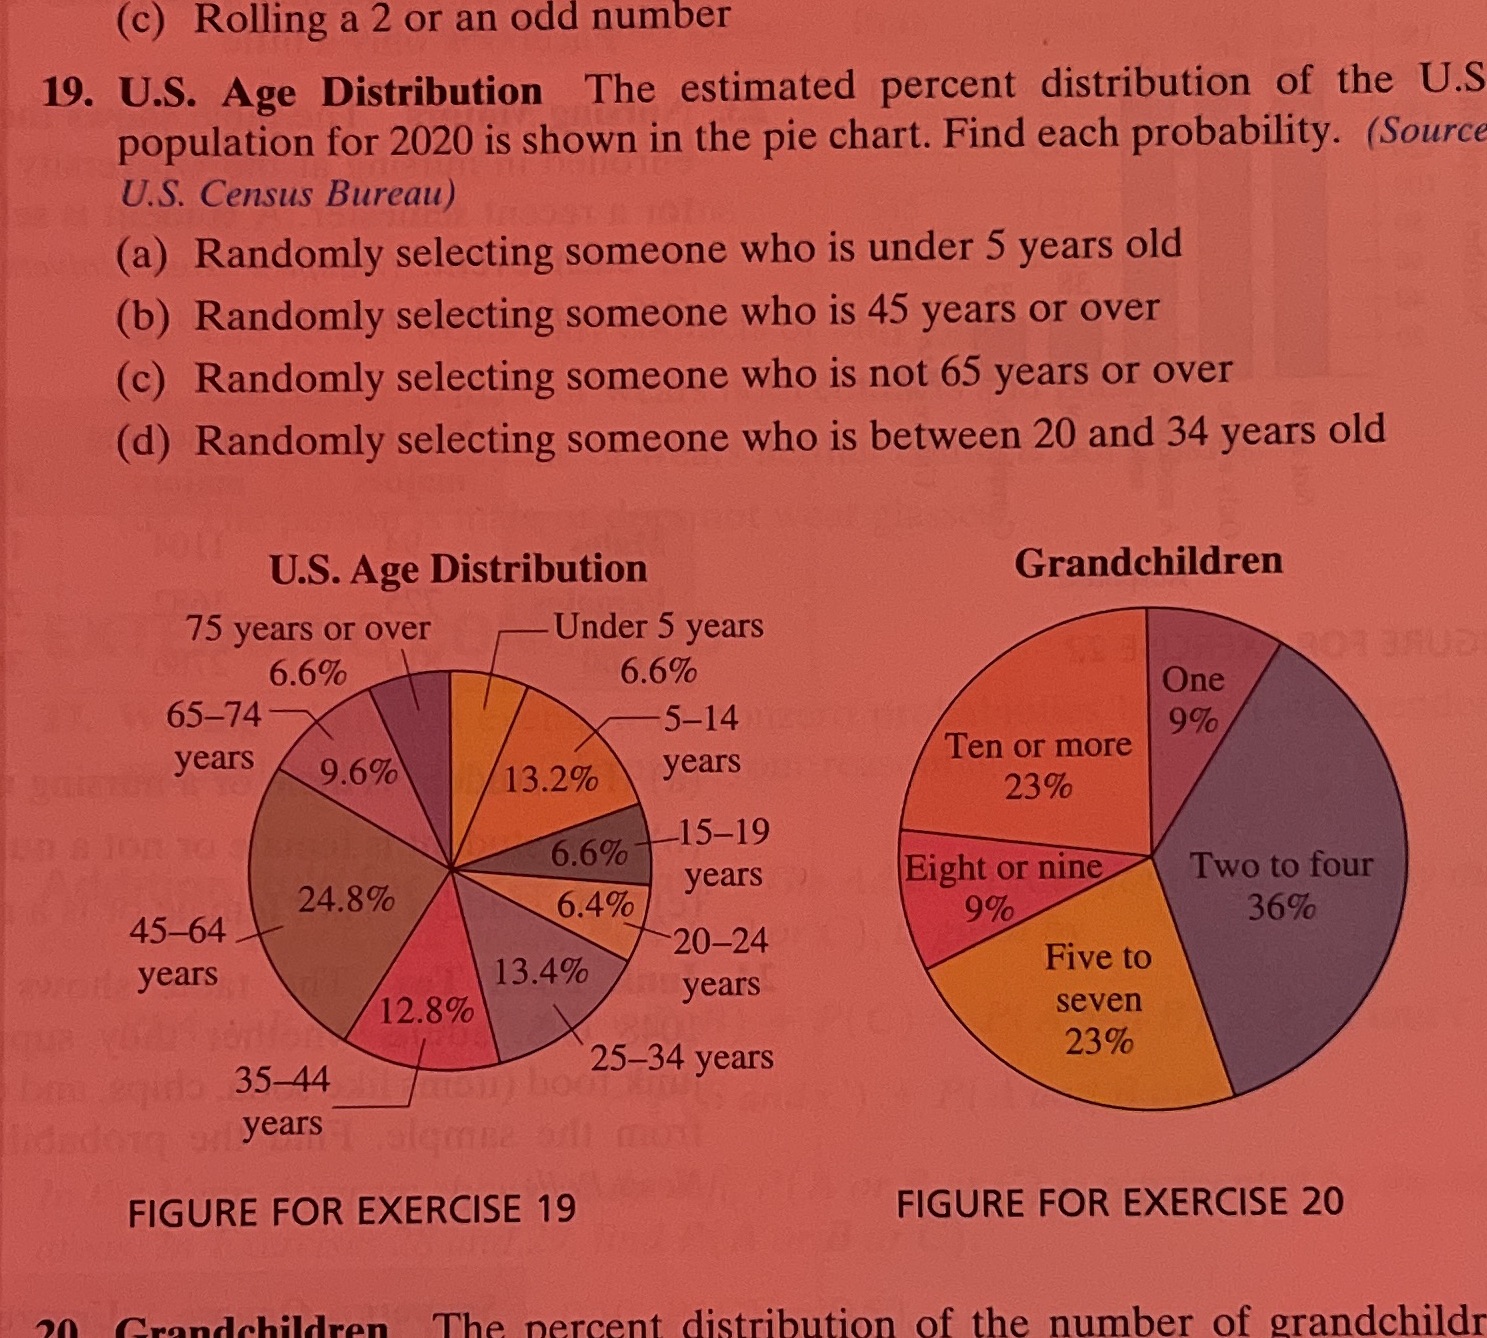
(c) Rolling a 2 or an odd number 19. U.S. Age Distribution The estimated percent distribution of the U.S population for 2020 is shown in the pie chart. Find each probability. (Source U.S. Census Bureau) (a) Randomly selecting someone who is under 5 years old (b) Randomly selecting someone who is 45 years or over (c) Randomly selecting someone who is not 65 years or over (d) Randomly selecting someone who is between 20 and 34 years old U.S. Age Distribution Grandchildren 75 years or over Under 5 years 6.6% 6.6% One 65-74- 5-14 9% years 9.6% 13.2% years Ten or more 23% 6.6% -15-19 years Eight or nine Two to four 24.8% 45-64 6.4% 9% 36% 20-24 years 13.4% Five to years 12.8% seven 35-44 25-34 years 23% waleme all mot FIGURE FOR EXERCISE 19 FIGURE FOR EXERCISE 20 The percent distribution of the number of grandchild
Step by Step Solution
There are 3 Steps involved in it

Get step-by-step solutions from verified subject matter experts