

Question: Please help, clean pictures and description provided :) Important notes for the answerer: The empty rows have a menu action list for their yellow boxes
Please help, clean pictures and description provided :)
Important notes for the answerer:
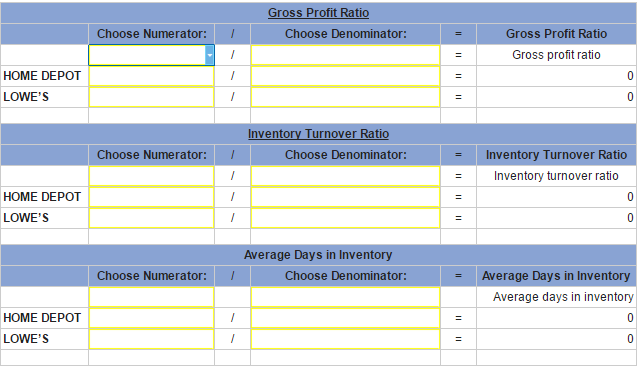
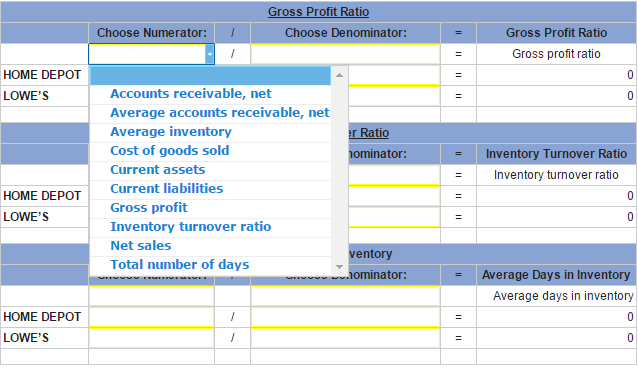
The empty rows have a menu action list for their yellow boxes which contains the following information (For both Choose Numerator and Choose Denominator).
For all the people who have been looking for this, this below is for you (Please ignore if you are an answerer).
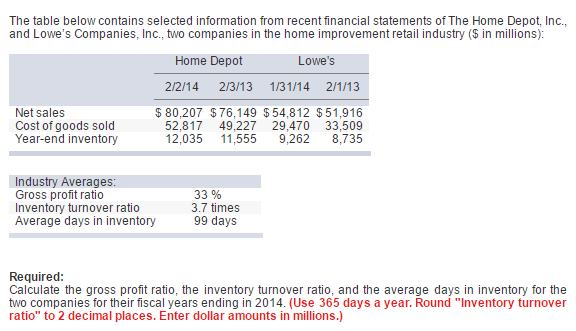
| The table below contains selected information from recent financial statements of The Home Depot, Inc., and Lowes Companies, Inc., two companies in the home improvement retail industry ($ in millions): |
| Home Depot | Lowe's | |||||||
| 2/2/14 | 2/3/13 | 1/31/14 | 2/1/13 | |||||
| Net sales | $ | 80,207 | $ | 76,149 | $ | 54,812 | $ | 51,916 |
| Cost of goods sold | 52,817 | 49,227 | 29,470 | 33,509 | ||||
| Year-end inventory | 12,035 | 11,555 | 9,262 | 8,735 | ||||
| Industry Averages: | |||
| Gross profit ratio | 33 | % | |
| Inventory turnover ratio | 3.7 | times | |
| Average days in inventory | 99 | days | |
|
| |||
| Required: |
| Calculate the gross profit ratio, the inventory turnover ratio, and the average days in inventory for the two companies for their fiscal years ending in 2014. (Use 365 days a year. Round "Inventory turnover ratio" to 2 decimal places. Enter dollar amounts in millions.)
-- End of text format -- Thank you for your time! |
Step by Step Solution
There are 3 Steps involved in it

Get step-by-step solutions from verified subject matter experts