

Question: Please help code inn python. Thank you. - Suppose that: L()=exp(10)210 - Knowing this information, calculate logL() and ddlogL() - Then create 3 plots one
Please help code inn python. Thank you.
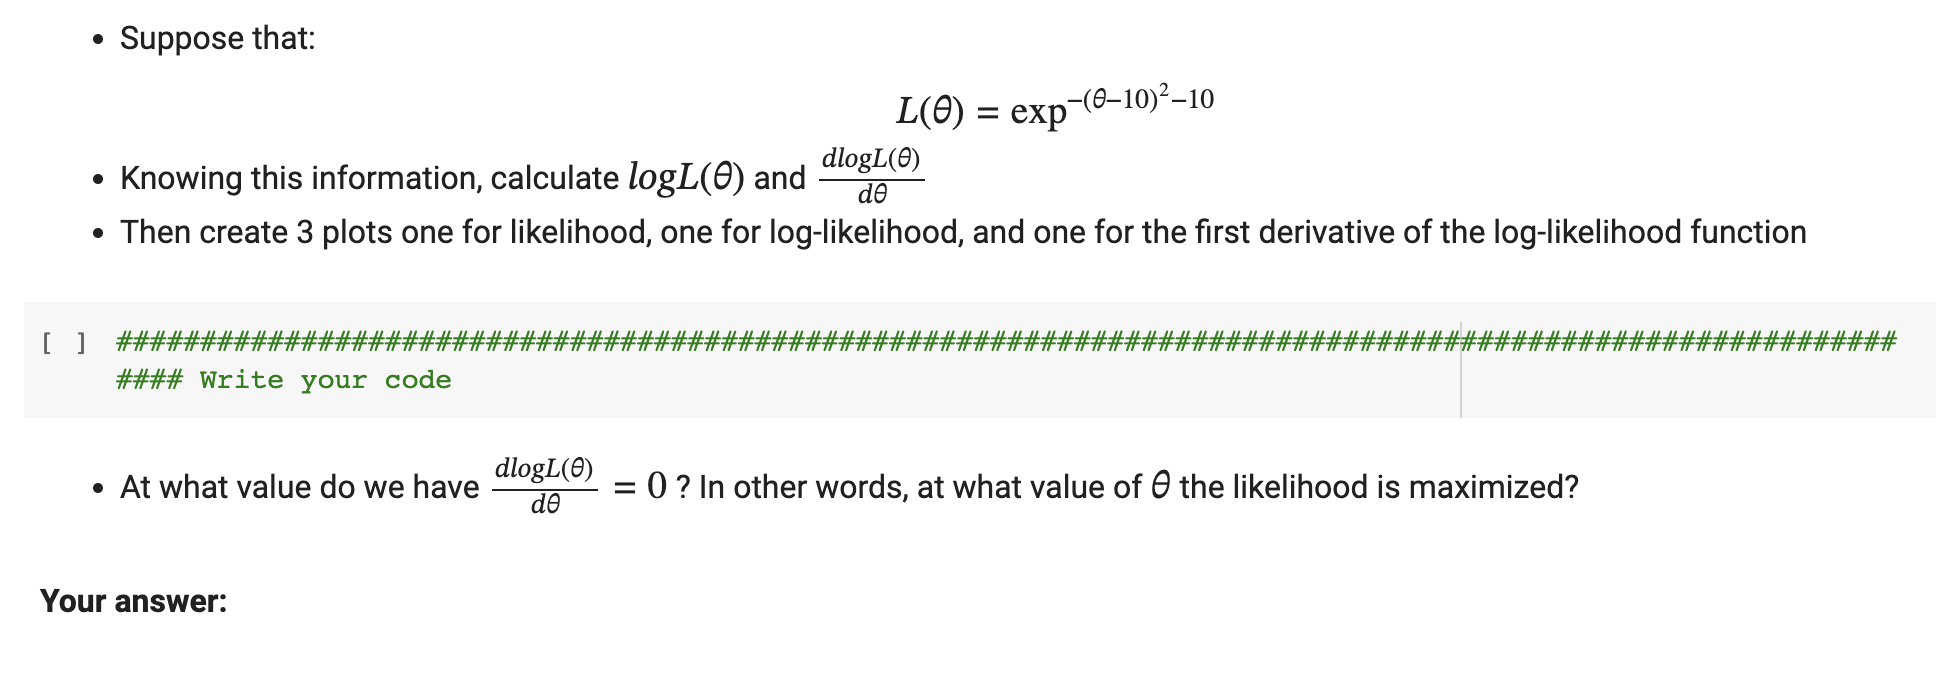
- Suppose that: L()=exp(10)210 - Knowing this information, calculate logL() and ddlogL() - Then create 3 plots one for likelihood, one for log-likelihood, and one for the first derivative of the log-likelihood function [ ] \#\#\#\#\#\#\#\#\#\#\#\#\#\#\#\#\#\#\#\#\#\#\#\#\#\#\#\#\#\#\#\#\#\#\#\#\#\#\#\#\#\#\#\#\#\#\#\#\#\#\#\#\#\#\#\#\#\#\#\#\#\#\#\#\#\#\#\#\#\#\#\#\#\#\#\#\#\#\#\#\#\#\#\#\#\#\#\#\#\#\#\#\#\#\#\#\#\#\#\#\#\#\#\#\#\# \#\#\#\# Write your code - At what value do we have ddlogL()=0 ? In other words, at what value of the likelihood is maximized
Step by Step Solution
There are 3 Steps involved in it
1 Expert Approved Answer
Step: 1 Unlock

Question Has Been Solved by an Expert!
Get step-by-step solutions from verified subject matter experts
Step: 2 Unlock
Step: 3 Unlock