

Question: Please help complete the threshold and evaluations. 2015 2014 Dollar Value % of Total Assets 2016 Actual Dollar Value % of Total Assets Dollar Value
Please help complete the threshold and evaluations.
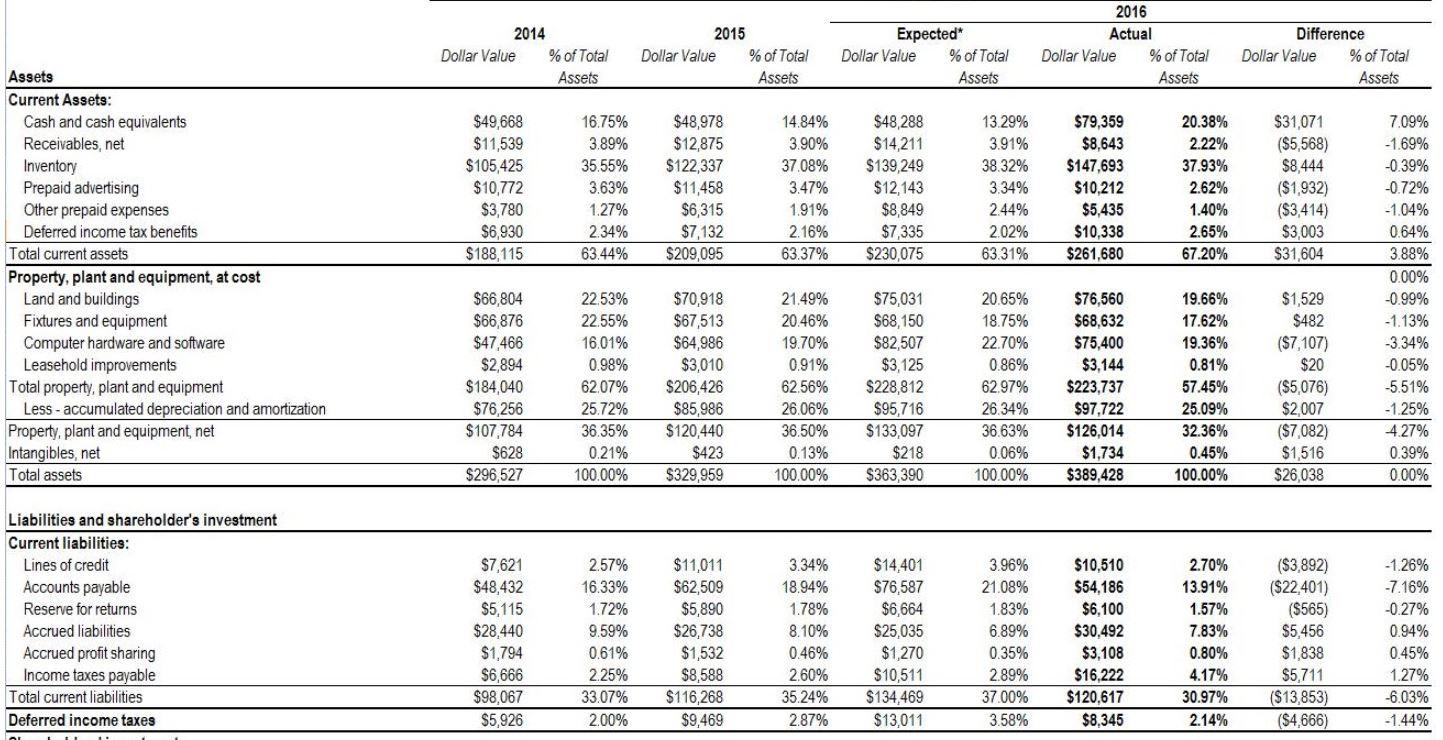
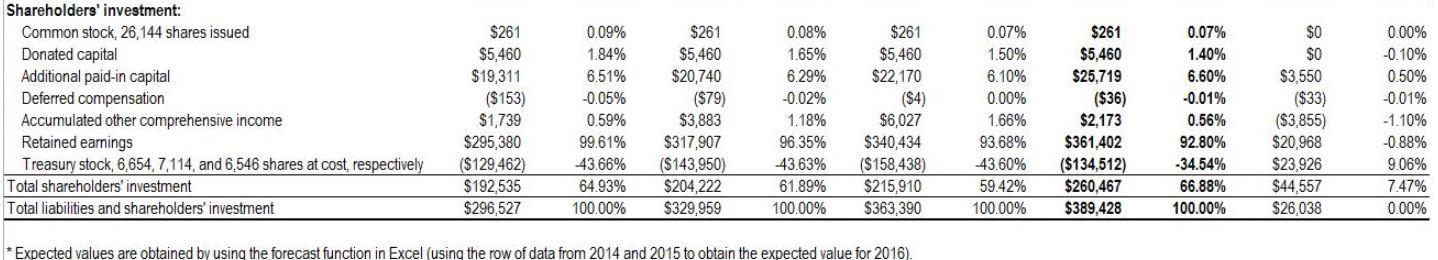
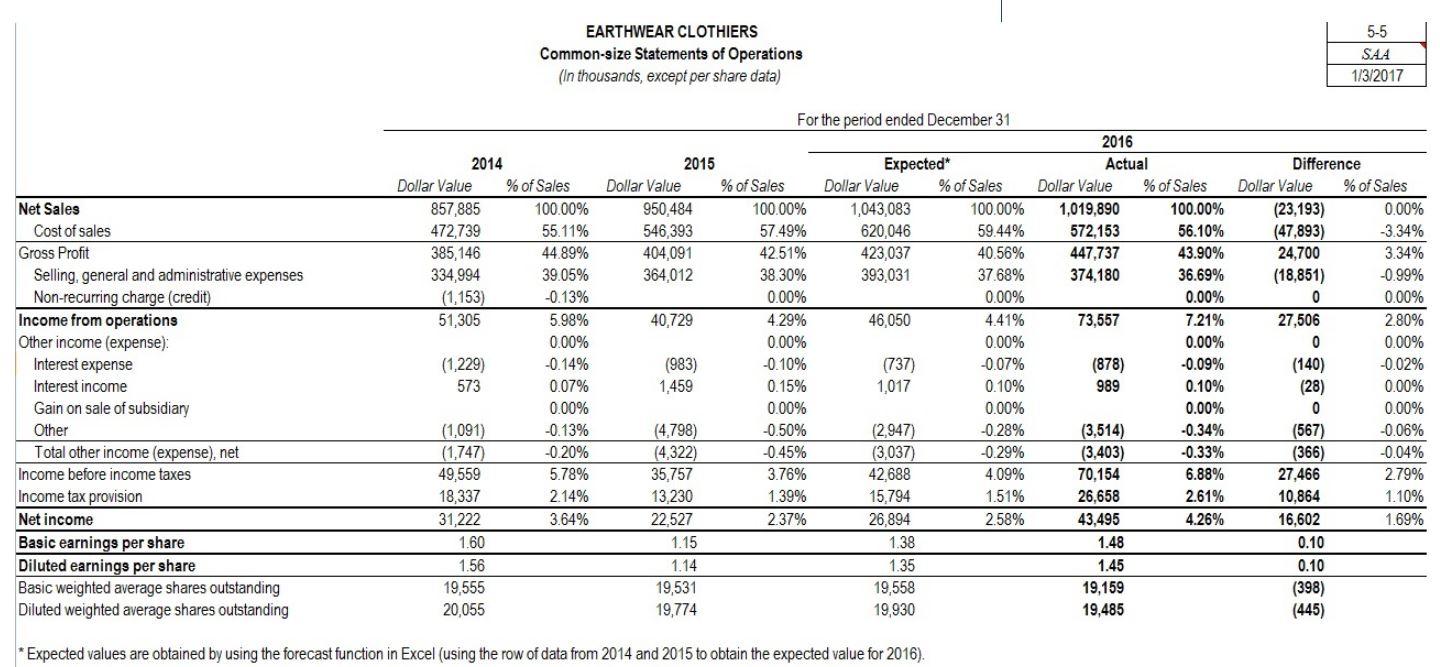
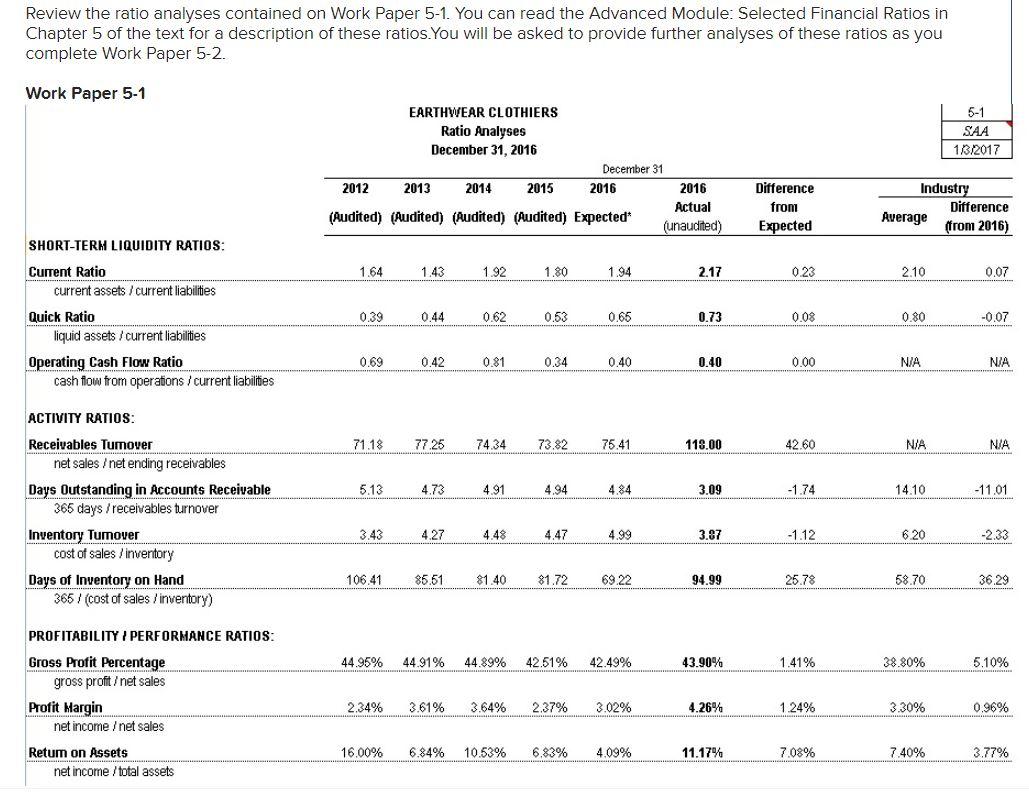
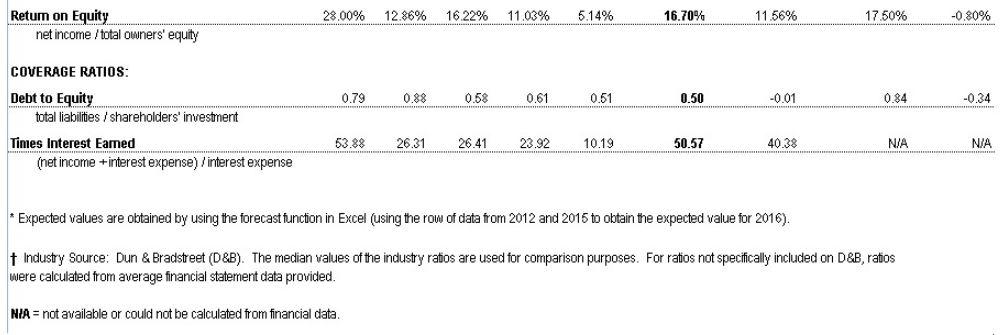
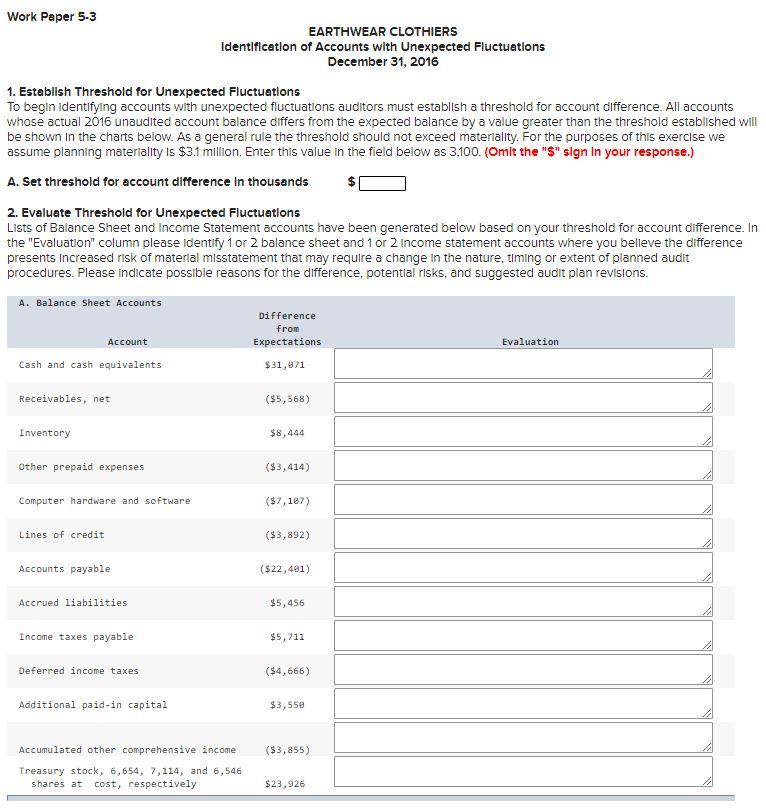
2015 2014 Dollar Value % of Total Assets 2016 Actual Dollar Value % of Total Assets Dollar Value Expected* Dollar Value % of Total Assets % of Total Assets Difference Dollar Value % of Total Assets $49,668 $11,539 $105,425 $10,772 $3,780 $6,930 $188,115 16.75% 3.89% 35.55% 3.63% 1.27% 2.34% 63.44% $48,978 $12,875 $122,337 $11,458 $6,315 $7,132 $209,095 14.84% 3.90% 37.08% 3.47% 1.91% 2.16% 63.37% $48,288 $14,211 $139,249 $12,143 $8,849 $7,335 $230,075 13.29% 3.91% 38.32% 3.34% 2.44% 2.02% 63.31% $79,359 $8,643 $147,693 $10,212 $5,435 $10,338 $261,680 20.38% 2.22% 37.93% 2.62% 1.40% 2.65% 67.20% $31,071 ($5,568) $8,444 ($1,932) ($3,414) $3,003 $31,604 Assets Current Assets: Cash and cash equivalents Receivables, net Inventory Prepaid advertising Other prepaid expenses Deferred income tax benefits Total current assets Property, plant and equipment, at cost Land and buildings Fixtures and equipment Computer hardware and software Leasehold improvements Total property, plant and equipment Less - accumulated depreciation and amortization Property, plant and equipment, net Intangibles, net Total assets $66,804 $66,876 $47,466 $2,894 $184,040 $76,256 $107,784 $628 $296,527 22.53% 22.55% 16.01% 0.98% 62.07% 25.72% 36.35% 0.21% 100.00% $70,918 $67,513 $64,986 $3,010 $206,426 $85,986 $120,440 $423 $329,959 21.49% 20.46% 19.70% 0.91% 62.56% 26.06% 36.50% 0.13% 100.00% $75,031 $68,150 $82,507 $3,125 $228,812 $95,716 $133,097 $218 $363,390 20.65% 18.75% 22.70% 0.86% 62.97% 26.34% 36.63% 0.06% 100.00% $76,560 $68,632 $75.400 $3,144 $223,737 $97,722 $126,014 $1,734 $389,428 19.66% 17.62% 19.36% 0.81% 57.45% 25.09% 32.36% 0.45% 100.00% $1,529 $482 ($7,107) $20 ($5,076) $2,007 ($7,082) $1,516 $26,038 7.09% -1.69% -0.39% -0.72% -1.04% 0.64% 3.88% 0.00% -0.99% -1.13% -3.34% -0.05% -5.51% -1.25% 4.27% 0.39% 0.00% Liabilities and shareholder's investment Current liabilities: Lines of credit Accounts payable Reserve for returns Accrued liabilities Accrued profit sharing Income taxes payable Total current liabilities Deferred income taxes $7,621 $48,432 $5,115 $28,440 $1,794 $6,666 $98,067 $5,926 2.57% 16.33% 1.72% 9.59% 0.61% 2.25% 33.07% 2.00% $11,011 $62,509 $5,890 $26,738 $1,532 $8,588 $116,268 $9,469 3.34% 18.94% 1.78% 8.10% 0.46% 2.60% 35.24% 2.87% $14,401 $76,587 $6,664 $25,035 $1,270 3.96% 21.08% 1.83% 6.89% 0.35% 2.89% 37.00% 3.58% $10,510 $54,186 $6,100 $30,492 $3,108 $16.222 $120.617 $8.345 2.70% 13.91% 1.57% 7.83% 0.80% 4.17% 30.97% 2.14% ($3,892) ($22.401) ($565) $5.456 $1,838 $5,711 ($13,853) ($4,666) -1.26% -7.16% -0.27% 0.94% 0.45% 1.27% -6.03% -1.44% $10,511 $134,469 $13,011 Tar 1 Shareholders' investment: Common stock, 26, 144 shares issued Donated capital Additional paid-in capital Deferred compensation Accumulated other comprehensive income Retained earnings Treasury stock, 6,654,7,114, and 6,546 shares at cost, respectively Total shareholders investment Total liabilities and shareholders' investment $261 $5,460 $19,311 ($153) $1,739 $295,380 ($129,462) $ 192,535 $296,527 0.09% 1.84% 6.51% -0.05% 0.59% 99.61% 43.66% 64.93% 100.00% $261 $5,460 $20,740 ($79) $3,883 $317,907 ($143,950) $204,222 $329,959 0.08% 1.65% 6.29% -0.02% 1.18% 96.35% 43.63% 61.89% 100.00% $261 $5,460 $22,170 ($4) $6,027 $340,434 ($158,438) $215,910 $363,390 0.07% 1.50% 6.10% 0.00% 1.66% 93.68% 43.60% 59.42% 100.00% $261 $5,460 $25,719 ($36) $2,173 $361,402 ($134,512) $260,467 $389,428 0.07% 1.40% 6.60% -0.01% 0.56% 92.80% -34.54% 66.88% 100.00% $0 $0 $3,550 ($33) ($3,855) $20,968 $23.926 $44,557 $26,038 0.00% -0.10% 0.50% -0.01% -1.10% -0.88% 9.06% 7.47% 0.00% * Expected values are obtained by using the forecast function in Excel (using the row of data from 2014 and 2015 to obtain the expected value for 2016). EARTHWEAR CLOTHIERS Common-size Statements of Operations (In thousands, except per share data) 5-5 S44 1/3/2017 For the period ended December 31 2015 Dollar Value 950,484 546,393 404,091 364,012 40,729 2014 Dollar Value % of Sales 857,885 100.00% 472,739 55.11% 385 146 44.89% 334,994 39.05% (1,153) -0.13% 51,305 5.98% 0.00% (1,229) -0.14% 573 0.07% 0.00% (1,091) -0.13% (1,747) -0.20% 49,559 5.78% 18,337 2.14% 31,222 3.64% 1.60 1.56 19,555 20,055 Net Sales Cost of sales Gross Profit Selling, general and administrative expenses Non-recurring charge (credit) Income from operations Other income (expense) Interest expense Interest income Gain on sale of subsidiary Other Total other income (expense), net Income before income taxes Income tax provision Net income Basic earnings per share Diluted earnings per share Basic weighted average shares outstanding Diluted weighted average shares outstanding % of Sales 100.00% 57.49% 42.51% 38.30% 0.00% 4.29% 0.00% -0.10% 0.15% 0.00% -0.50% -0.45% 3.76% 1.39% 2.37% (983) 1,459 Expected* Dollar Value % of Sales 1,043,083 100.00% 620,046 59.44% 423,037 40.56% 393,031 37.68% 0.00% 46,050 4.41% 0.00% (737) -0.07% 1,017 0.10% 0.00% (2,947) -0.28% (3,037) -0.29% 42.688 4.09% 15,794 1.51% 26,894 2.58% 1.38 1.35 19,558 19,930 2016 Actual Dollar Value % of Sales 1,019,890 100.00% 572,153 56.10% 447.737 43.90% 374,180 36.69% 0.00% 73,557 7.21% 0.00% (878) -0.09% 989 0.10% 0.00% (3,514) -0.34% (3,403) -0.33% 70,154 6.88% 26,658 2.61% 43,495 4.26% 1.48 1.45 19,159 19,485 Difference Dollar Value % of Sales (23,193) 0.00% (47,893) -3.34% 24,700 3.34% (18,851) -0.99% 0 0.00% 27,506 2.80% 0 0.00% (140) -0.02% (28) 0.00% 0 0.00% (567) -0.06% (366) -0.04% 27,466 2.79% 10,864 1.10% 16.602 1.69% 0.10 0.10 (398) (445) (4,798) (4.322) 35,757 13.230 22,527 1.15 1.14 19,531 19,774 * Expected values are obtained by using the forecast function in Excel (using the row of data from 2014 and 2015 to obtain the expected value for 2016). Review the ratio analyses contained on Work Paper 5-1. You can read the Advanced Module: Selected Financial Ratios in Chapter 5 of the text for a description of these ratios. You will be asked to provide further analyses of these ratios as you complete Work Paper 5-2. Work Paper 5-1 5-1 SAA 113/2017 EARTHWEAR CLOTHIERS Ratio Analyses December 31, 2016 December 31 2012 2013 2014 2015 2016 2016 Actual (Audited) (Audited) (Audited) (Audited) Expected* (unaudited) Difference from Expected Industry Difference Average (from 2016) 1.64 1.43 1.92 1.80 1.94 2.17 0.23 2.10 0.07 SHORT-TERM LIQUIDITY RATIOS: Current Ratio current assets / current liabilities Quick Ratio liquid assets/current liabilities Operating Cash Flow Ratio cash flow from operations / current liabilities 0.39 0.44 0.62 0.53 0.65 0.73 0.08 0.80 -0.07 0.69 0.42 0.81 0.34 0.40 0.40 0.00 N/A NA ACTIVITY RATIOS: 71.18 77.25 74.34 73.82 75.41 118.00 42.60 N/A N/A 5.13 4.73 4.91 4.94 4.84 3.09 -1.74 14.10 -11.01 Receivables Tumover net sales / net ending receivables Days Outstanding in Accounts Receivable 365 days /receivables turnover Inventory Tumover cost of sales /inventory Days of Inventory on Hand 365 / (cost of sales /inventory) 3.43 4.27 4.48 4.47 4.99 3.87 -1.12 620 -2.33 106.41 85.51 81.40 81.72 6922 94.99 25.78 58.70 36.29 44.95% 44.91% 44.89% 42.51% 42.49% 43.90% 1.41% 38.80% 5.10% PROFITABILITY / PERFORMANCE RATIOS: Gross Profit Percentage gross profit net sales Profit Margin net income / net sales 2.34% 3.61% 3.64% 2.37% 3.02% 4.26% 1.24% 3.30% 0.96% 16.00% 6.84% 10.53% 6,83% 4.09% 11.17% 7.08% 7.40% 3.77% Retum on Assets net income /total assets 28.00% 12.86% 16 22% 11.03% 5.14% 16.70% 11.56% 17.50% -0.80% Retum on Equity net income /total owners' equity COVERAGE RATIOS: Debt to Equity total liabilities / shareholders' investment 0.79 0.88 0.58 0.61 0.51 0.50 -0.01 0.84 -0.34 53.88 26.31 26.41 23.92 10.19 50.57 40.38 NIA N/A Times Interest Eamed (net income +interest expense) / interest expense * Expected values are obtained by using the forecast function in Excel (using the row of data from 2012 and 2015 to obtain the expected value for 2016). Industry Source: Dun & Bradstreet (D&B). The median values of the industry ratios are used for comparison purposes. For ratios not specifically included on D&B, ratios were calculated from average financial statement data provided NIA = not available or could not be calculated from financial data. Work Paper 5-3 EARTHWEAR CLOTHIERS Identification of Accounts with Unexpected Fluctuations December 31, 2016 1. Establish Threshold for Unexpected Fluctuations To begin identifying accounts with unexpected fluctuations auditors must establish a threshold for account difference. All accounts whose actual 2016 unaudited account balance differs from the expected balance by a value greater than the threshold established will be shown in the charts below. As a general rule the threshold should not exceed materiality. For the purposes of this exercise we assume planning materiality is $3.1 million. Enter this value in the field below as 3,100. (Omit the "$" sign In your response.) A. Set threshold for account difference in thousands 2. Evaluate Threshold for Unexpected Fluctuations Lists of Balance Sheet and Income Statement accounts have been generated below based on your threshold for account difference. In the "Evaluation" column please Identify 1 or 2 balance sheet and 1 or 2 Income statement accounts where you believe the difference presents Increased risk of material misstatement that may require a change in the nature, timing or extent of planned audit procedures. Please indicate possible reasons for the difference, potential risks, and suggested audit plan revisions. A. Balance sheet Accounts Difference from Account Expectations Cash and cash equivalents $31,871 Evaluation Receivables, net ($5,568) Inventory $8,444 Other prepaid expenses ($3,414) Computer hardware and software ($7,187) Lines of credit ($3,892) Accounts payable ($22,401) Accrued liabilities $5,456 Income taxes payable $5,711 Deferred income taxes ($4,666) Additional paid-in capital $3,550 ($3,855) Accumulated other comprehensive income Treasury stock, 6,654, 7,114, and 6,546 shares at cost, respectively $23,926 2015 2014 Dollar Value % of Total Assets 2016 Actual Dollar Value % of Total Assets Dollar Value Expected* Dollar Value % of Total Assets % of Total Assets Difference Dollar Value % of Total Assets $49,668 $11,539 $105,425 $10,772 $3,780 $6,930 $188,115 16.75% 3.89% 35.55% 3.63% 1.27% 2.34% 63.44% $48,978 $12,875 $122,337 $11,458 $6,315 $7,132 $209,095 14.84% 3.90% 37.08% 3.47% 1.91% 2.16% 63.37% $48,288 $14,211 $139,249 $12,143 $8,849 $7,335 $230,075 13.29% 3.91% 38.32% 3.34% 2.44% 2.02% 63.31% $79,359 $8,643 $147,693 $10,212 $5,435 $10,338 $261,680 20.38% 2.22% 37.93% 2.62% 1.40% 2.65% 67.20% $31,071 ($5,568) $8,444 ($1,932) ($3,414) $3,003 $31,604 Assets Current Assets: Cash and cash equivalents Receivables, net Inventory Prepaid advertising Other prepaid expenses Deferred income tax benefits Total current assets Property, plant and equipment, at cost Land and buildings Fixtures and equipment Computer hardware and software Leasehold improvements Total property, plant and equipment Less - accumulated depreciation and amortization Property, plant and equipment, net Intangibles, net Total assets $66,804 $66,876 $47,466 $2,894 $184,040 $76,256 $107,784 $628 $296,527 22.53% 22.55% 16.01% 0.98% 62.07% 25.72% 36.35% 0.21% 100.00% $70,918 $67,513 $64,986 $3,010 $206,426 $85,986 $120,440 $423 $329,959 21.49% 20.46% 19.70% 0.91% 62.56% 26.06% 36.50% 0.13% 100.00% $75,031 $68,150 $82,507 $3,125 $228,812 $95,716 $133,097 $218 $363,390 20.65% 18.75% 22.70% 0.86% 62.97% 26.34% 36.63% 0.06% 100.00% $76,560 $68,632 $75.400 $3,144 $223,737 $97,722 $126,014 $1,734 $389,428 19.66% 17.62% 19.36% 0.81% 57.45% 25.09% 32.36% 0.45% 100.00% $1,529 $482 ($7,107) $20 ($5,076) $2,007 ($7,082) $1,516 $26,038 7.09% -1.69% -0.39% -0.72% -1.04% 0.64% 3.88% 0.00% -0.99% -1.13% -3.34% -0.05% -5.51% -1.25% 4.27% 0.39% 0.00% Liabilities and shareholder's investment Current liabilities: Lines of credit Accounts payable Reserve for returns Accrued liabilities Accrued profit sharing Income taxes payable Total current liabilities Deferred income taxes $7,621 $48,432 $5,115 $28,440 $1,794 $6,666 $98,067 $5,926 2.57% 16.33% 1.72% 9.59% 0.61% 2.25% 33.07% 2.00% $11,011 $62,509 $5,890 $26,738 $1,532 $8,588 $116,268 $9,469 3.34% 18.94% 1.78% 8.10% 0.46% 2.60% 35.24% 2.87% $14,401 $76,587 $6,664 $25,035 $1,270 3.96% 21.08% 1.83% 6.89% 0.35% 2.89% 37.00% 3.58% $10,510 $54,186 $6,100 $30,492 $3,108 $16.222 $120.617 $8.345 2.70% 13.91% 1.57% 7.83% 0.80% 4.17% 30.97% 2.14% ($3,892) ($22.401) ($565) $5.456 $1,838 $5,711 ($13,853) ($4,666) -1.26% -7.16% -0.27% 0.94% 0.45% 1.27% -6.03% -1.44% $10,511 $134,469 $13,011 Tar 1 Shareholders' investment: Common stock, 26, 144 shares issued Donated capital Additional paid-in capital Deferred compensation Accumulated other comprehensive income Retained earnings Treasury stock, 6,654,7,114, and 6,546 shares at cost, respectively Total shareholders investment Total liabilities and shareholders' investment $261 $5,460 $19,311 ($153) $1,739 $295,380 ($129,462) $ 192,535 $296,527 0.09% 1.84% 6.51% -0.05% 0.59% 99.61% 43.66% 64.93% 100.00% $261 $5,460 $20,740 ($79) $3,883 $317,907 ($143,950) $204,222 $329,959 0.08% 1.65% 6.29% -0.02% 1.18% 96.35% 43.63% 61.89% 100.00% $261 $5,460 $22,170 ($4) $6,027 $340,434 ($158,438) $215,910 $363,390 0.07% 1.50% 6.10% 0.00% 1.66% 93.68% 43.60% 59.42% 100.00% $261 $5,460 $25,719 ($36) $2,173 $361,402 ($134,512) $260,467 $389,428 0.07% 1.40% 6.60% -0.01% 0.56% 92.80% -34.54% 66.88% 100.00% $0 $0 $3,550 ($33) ($3,855) $20,968 $23.926 $44,557 $26,038 0.00% -0.10% 0.50% -0.01% -1.10% -0.88% 9.06% 7.47% 0.00% * Expected values are obtained by using the forecast function in Excel (using the row of data from 2014 and 2015 to obtain the expected value for 2016). EARTHWEAR CLOTHIERS Common-size Statements of Operations (In thousands, except per share data) 5-5 S44 1/3/2017 For the period ended December 31 2015 Dollar Value 950,484 546,393 404,091 364,012 40,729 2014 Dollar Value % of Sales 857,885 100.00% 472,739 55.11% 385 146 44.89% 334,994 39.05% (1,153) -0.13% 51,305 5.98% 0.00% (1,229) -0.14% 573 0.07% 0.00% (1,091) -0.13% (1,747) -0.20% 49,559 5.78% 18,337 2.14% 31,222 3.64% 1.60 1.56 19,555 20,055 Net Sales Cost of sales Gross Profit Selling, general and administrative expenses Non-recurring charge (credit) Income from operations Other income (expense) Interest expense Interest income Gain on sale of subsidiary Other Total other income (expense), net Income before income taxes Income tax provision Net income Basic earnings per share Diluted earnings per share Basic weighted average shares outstanding Diluted weighted average shares outstanding % of Sales 100.00% 57.49% 42.51% 38.30% 0.00% 4.29% 0.00% -0.10% 0.15% 0.00% -0.50% -0.45% 3.76% 1.39% 2.37% (983) 1,459 Expected* Dollar Value % of Sales 1,043,083 100.00% 620,046 59.44% 423,037 40.56% 393,031 37.68% 0.00% 46,050 4.41% 0.00% (737) -0.07% 1,017 0.10% 0.00% (2,947) -0.28% (3,037) -0.29% 42.688 4.09% 15,794 1.51% 26,894 2.58% 1.38 1.35 19,558 19,930 2016 Actual Dollar Value % of Sales 1,019,890 100.00% 572,153 56.10% 447.737 43.90% 374,180 36.69% 0.00% 73,557 7.21% 0.00% (878) -0.09% 989 0.10% 0.00% (3,514) -0.34% (3,403) -0.33% 70,154 6.88% 26,658 2.61% 43,495 4.26% 1.48 1.45 19,159 19,485 Difference Dollar Value % of Sales (23,193) 0.00% (47,893) -3.34% 24,700 3.34% (18,851) -0.99% 0 0.00% 27,506 2.80% 0 0.00% (140) -0.02% (28) 0.00% 0 0.00% (567) -0.06% (366) -0.04% 27,466 2.79% 10,864 1.10% 16.602 1.69% 0.10 0.10 (398) (445) (4,798) (4.322) 35,757 13.230 22,527 1.15 1.14 19,531 19,774 * Expected values are obtained by using the forecast function in Excel (using the row of data from 2014 and 2015 to obtain the expected value for 2016). Review the ratio analyses contained on Work Paper 5-1. You can read the Advanced Module: Selected Financial Ratios in Chapter 5 of the text for a description of these ratios. You will be asked to provide further analyses of these ratios as you complete Work Paper 5-2. Work Paper 5-1 5-1 SAA 113/2017 EARTHWEAR CLOTHIERS Ratio Analyses December 31, 2016 December 31 2012 2013 2014 2015 2016 2016 Actual (Audited) (Audited) (Audited) (Audited) Expected* (unaudited) Difference from Expected Industry Difference Average (from 2016) 1.64 1.43 1.92 1.80 1.94 2.17 0.23 2.10 0.07 SHORT-TERM LIQUIDITY RATIOS: Current Ratio current assets / current liabilities Quick Ratio liquid assets/current liabilities Operating Cash Flow Ratio cash flow from operations / current liabilities 0.39 0.44 0.62 0.53 0.65 0.73 0.08 0.80 -0.07 0.69 0.42 0.81 0.34 0.40 0.40 0.00 N/A NA ACTIVITY RATIOS: 71.18 77.25 74.34 73.82 75.41 118.00 42.60 N/A N/A 5.13 4.73 4.91 4.94 4.84 3.09 -1.74 14.10 -11.01 Receivables Tumover net sales / net ending receivables Days Outstanding in Accounts Receivable 365 days /receivables turnover Inventory Tumover cost of sales /inventory Days of Inventory on Hand 365 / (cost of sales /inventory) 3.43 4.27 4.48 4.47 4.99 3.87 -1.12 620 -2.33 106.41 85.51 81.40 81.72 6922 94.99 25.78 58.70 36.29 44.95% 44.91% 44.89% 42.51% 42.49% 43.90% 1.41% 38.80% 5.10% PROFITABILITY / PERFORMANCE RATIOS: Gross Profit Percentage gross profit net sales Profit Margin net income / net sales 2.34% 3.61% 3.64% 2.37% 3.02% 4.26% 1.24% 3.30% 0.96% 16.00% 6.84% 10.53% 6,83% 4.09% 11.17% 7.08% 7.40% 3.77% Retum on Assets net income /total assets 28.00% 12.86% 16 22% 11.03% 5.14% 16.70% 11.56% 17.50% -0.80% Retum on Equity net income /total owners' equity COVERAGE RATIOS: Debt to Equity total liabilities / shareholders' investment 0.79 0.88 0.58 0.61 0.51 0.50 -0.01 0.84 -0.34 53.88 26.31 26.41 23.92 10.19 50.57 40.38 NIA N/A Times Interest Eamed (net income +interest expense) / interest expense * Expected values are obtained by using the forecast function in Excel (using the row of data from 2012 and 2015 to obtain the expected value for 2016). Industry Source: Dun & Bradstreet (D&B). The median values of the industry ratios are used for comparison purposes. For ratios not specifically included on D&B, ratios were calculated from average financial statement data provided NIA = not available or could not be calculated from financial data. Work Paper 5-3 EARTHWEAR CLOTHIERS Identification of Accounts with Unexpected Fluctuations December 31, 2016 1. Establish Threshold for Unexpected Fluctuations To begin identifying accounts with unexpected fluctuations auditors must establish a threshold for account difference. All accounts whose actual 2016 unaudited account balance differs from the expected balance by a value greater than the threshold established will be shown in the charts below. As a general rule the threshold should not exceed materiality. For the purposes of this exercise we assume planning materiality is $3.1 million. Enter this value in the field below as 3,100. (Omit the "$" sign In your response.) A. Set threshold for account difference in thousands 2. Evaluate Threshold for Unexpected Fluctuations Lists of Balance Sheet and Income Statement accounts have been generated below based on your threshold for account difference. In the "Evaluation" column please Identify 1 or 2 balance sheet and 1 or 2 Income statement accounts where you believe the difference presents Increased risk of material misstatement that may require a change in the nature, timing or extent of planned audit procedures. Please indicate possible reasons for the difference, potential risks, and suggested audit plan revisions. A. Balance sheet Accounts Difference from Account Expectations Cash and cash equivalents $31,871 Evaluation Receivables, net ($5,568) Inventory $8,444 Other prepaid expenses ($3,414) Computer hardware and software ($7,187) Lines of credit ($3,892) Accounts payable ($22,401) Accrued liabilities $5,456 Income taxes payable $5,711 Deferred income taxes ($4,666) Additional paid-in capital $3,550 ($3,855) Accumulated other comprehensive income Treasury stock, 6,654, 7,114, and 6,546 shares at cost, respectively $23,926
Step by Step Solution
There are 3 Steps involved in it

Get step-by-step solutions from verified subject matter experts