

Question: Please help Consider the following graph. 4 401 30 20 10 -2 2 (a) Estimate the input value of the inflection point. X = (b)

Please help
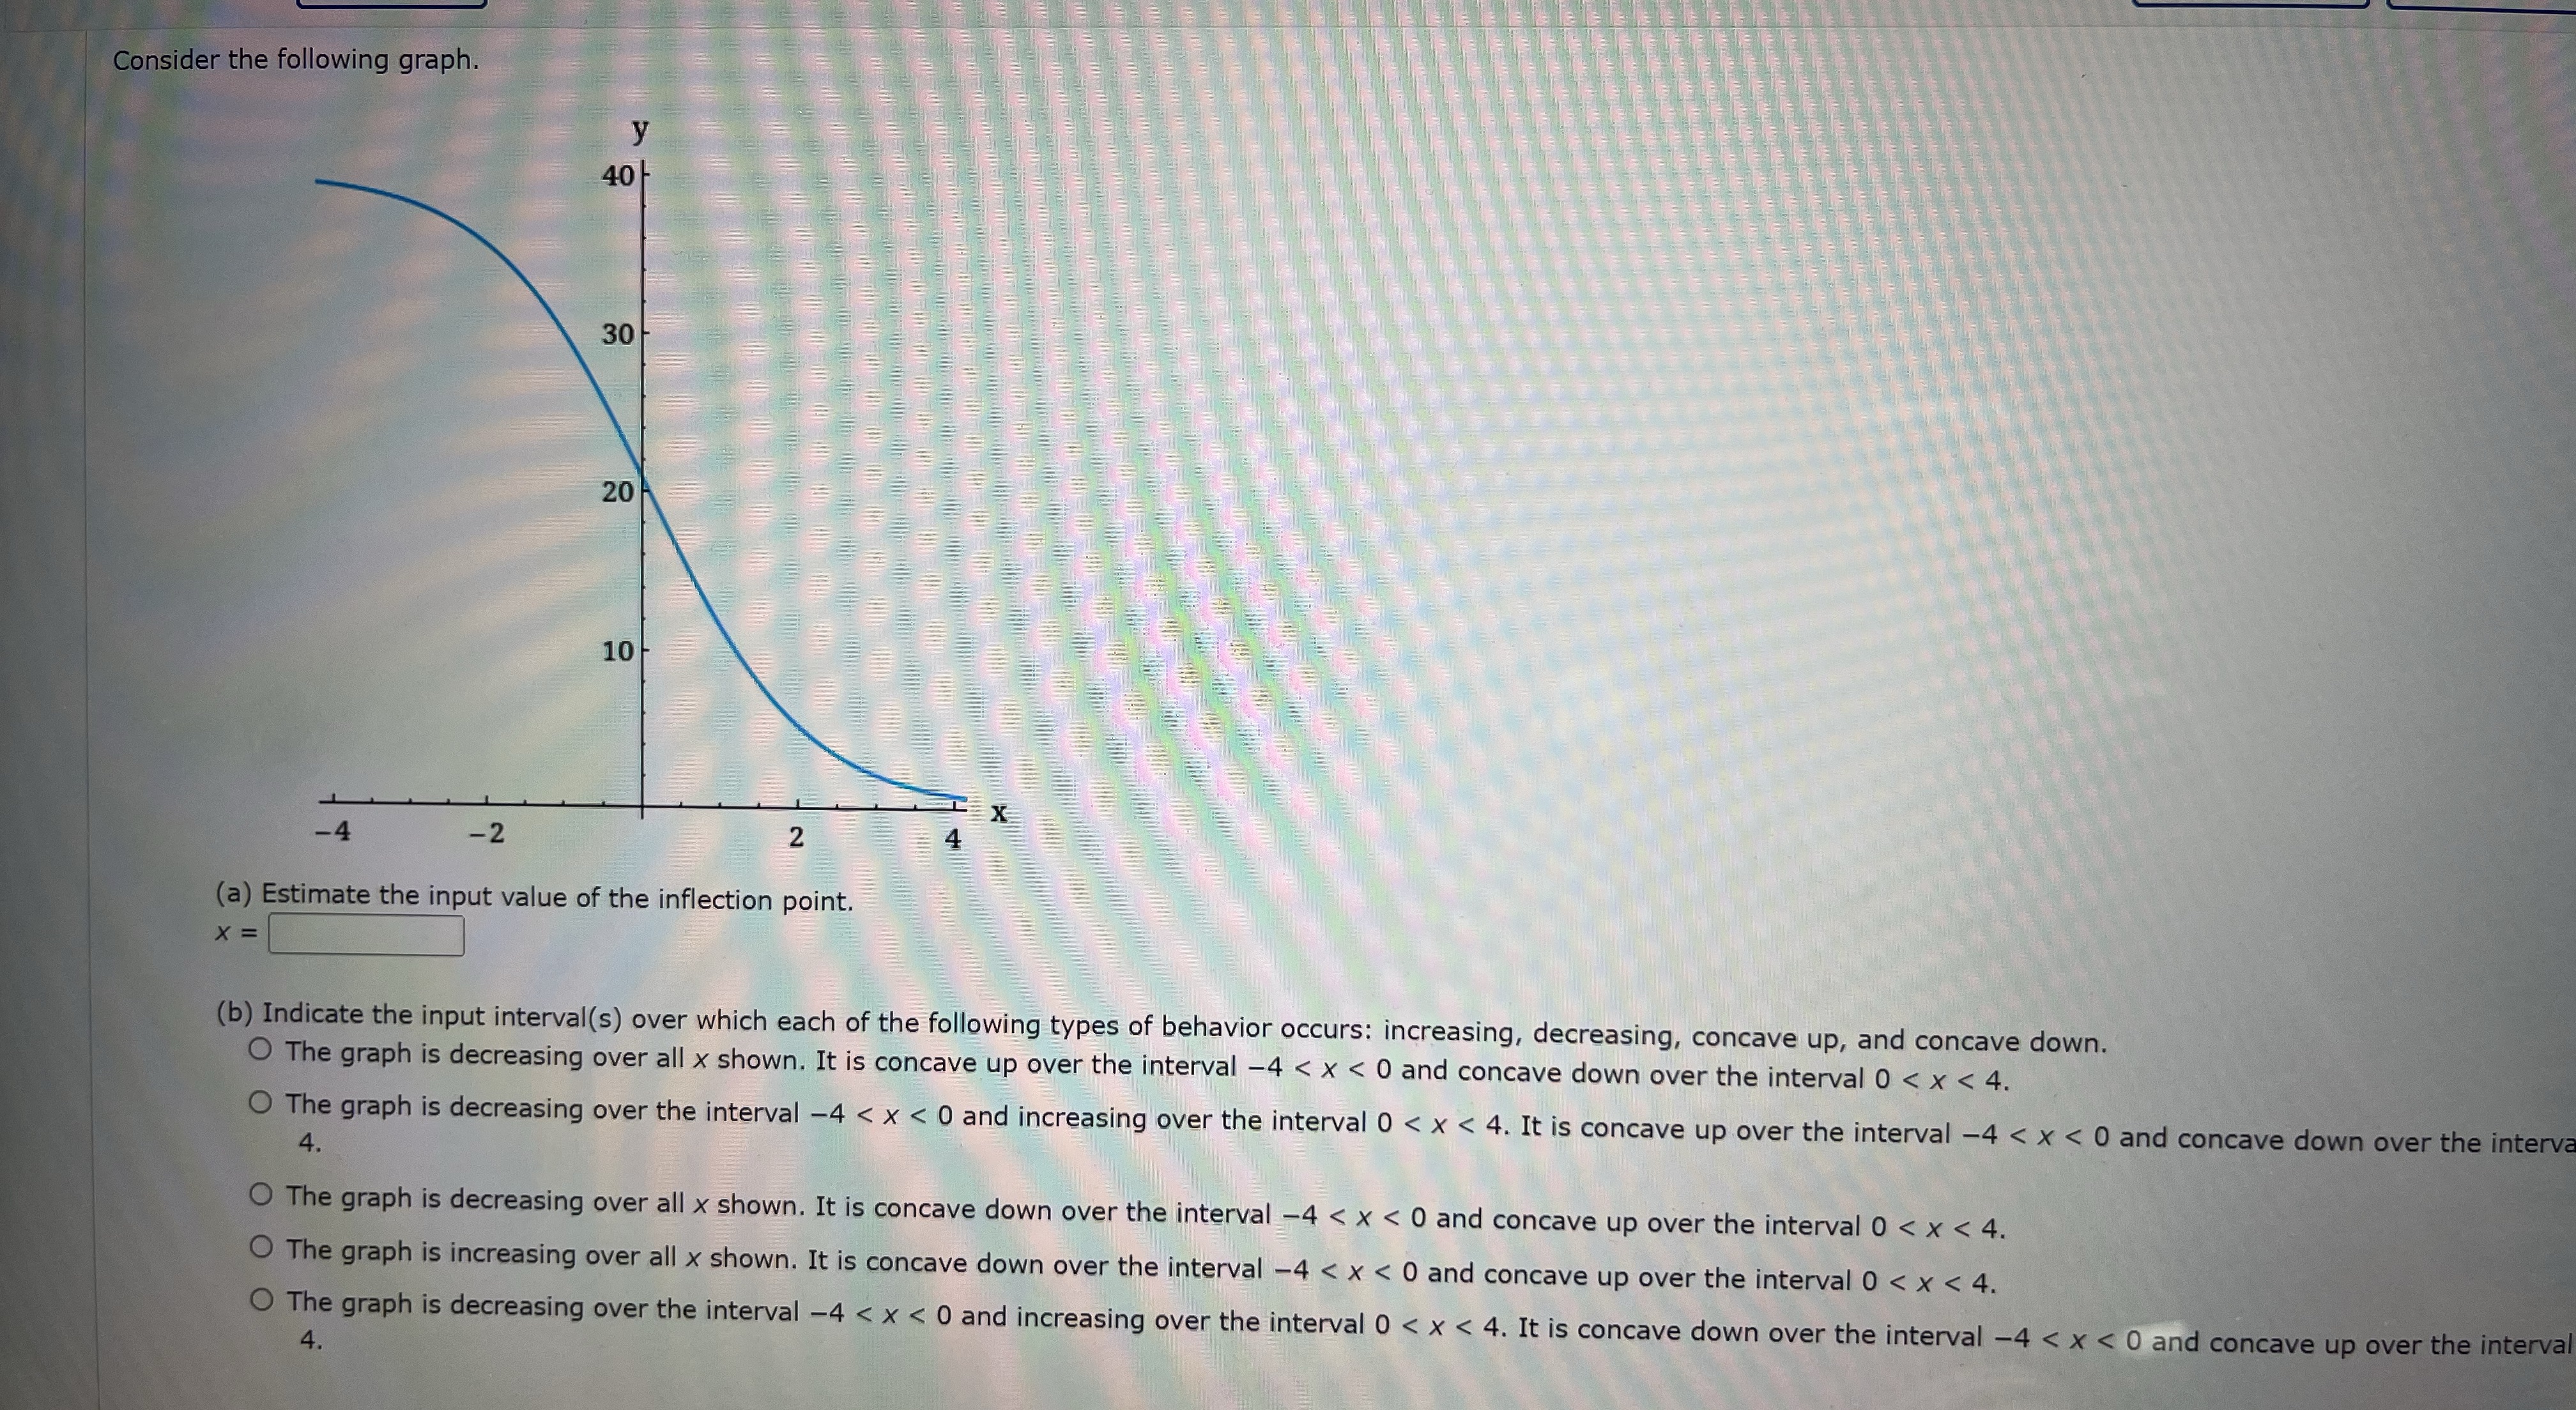
Consider the following graph. 4 401 30 20 10 -2 2 (a) Estimate the input value of the inflection point. X = (b) Indicate the input interval(s) over which each of the following types of behavior occurs: increasing, decreasing, concave up, and concave down. The graph is decreasing over all x shown. It is concave up over the interval -4
Step by Step Solution
There are 3 Steps involved in it
1 Expert Approved Answer
Step: 1 Unlock

Question Has Been Solved by an Expert!
Get step-by-step solutions from verified subject matter experts
Step: 2 Unlock
Step: 3 Unlock