

Question: please help Consider the following printout: Two-Sample T Tests for Size by Location Location N Mean SD SE 1 25 31024 1407.3 281.45 25 37214
please help
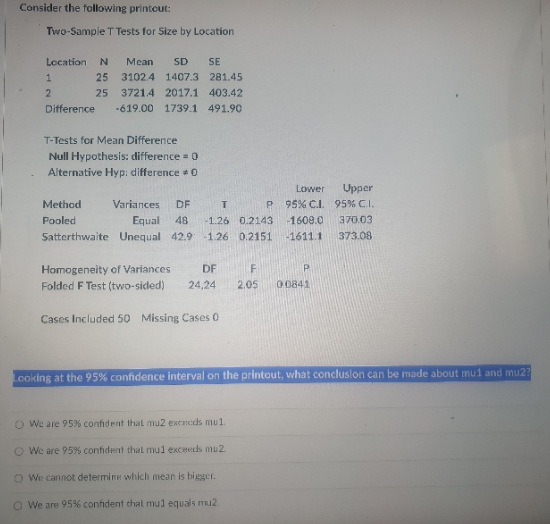
Consider the following printout: Two-Sample T Tests for Size by Location Location N Mean SD SE 1 25 31024 1407.3 281.45 25 37214 2017.1 403.42 Difference -619.00 1739.1 491.90 T-Tests for Mean Difference Null Hypothesis: difference = 0 Alternative Hyp: difference * 0 Lower Upper Method Variances DF T 95% CI. 95% C.I. Pooled Equal 48 -1.26 0.2143 -1609.0 370.03 Satterthwaite Unequal 42.9 -126 0.2151 -1611.1 373.08 Homogeneity of Variances DF F P Folded F Test (two-sided) 24,24 2.05 0 0841 Cases Included 50 Missing Cases 0 coking at the 95% confidence interval on the printout, what conclusion can be made about mul and mu2? We are 95% confident that mu2 exceeds mul. We are 9575 confident that mul exceeds mu2 O We cannot determine which mean is bigger. O We are 95% confident that mul equals mu2
Step by Step Solution
There are 3 Steps involved in it

Get step-by-step solutions from verified subject matter experts