

Question: Please help create a projected balance sheet based on the assumptions given. Please do it in Excel and include the formulas. 3. Create projected balance
Please help create a projected balance sheet based on the assumptions given. Please do it in Excel and include the formulas.
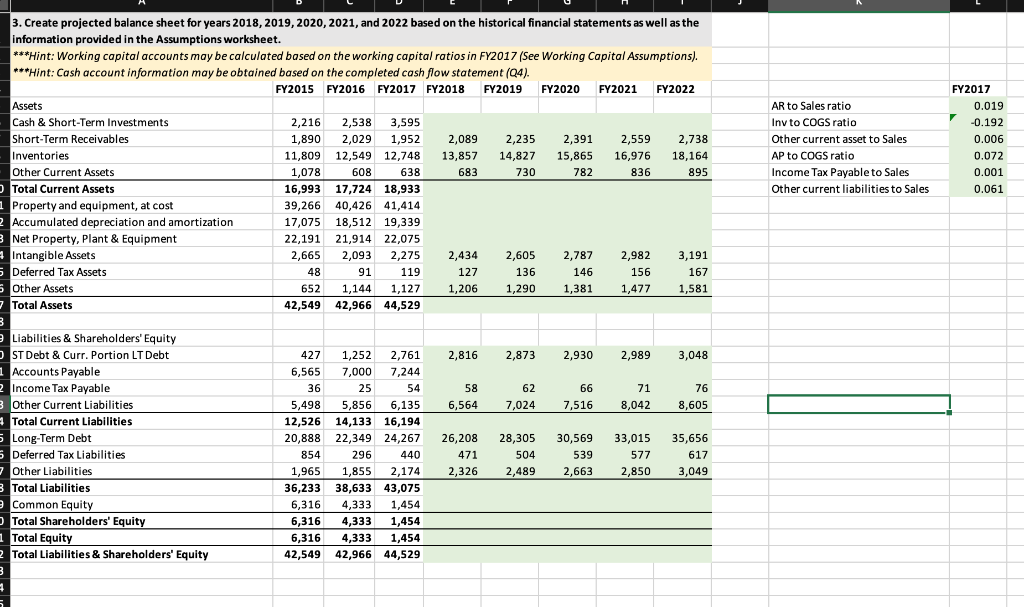
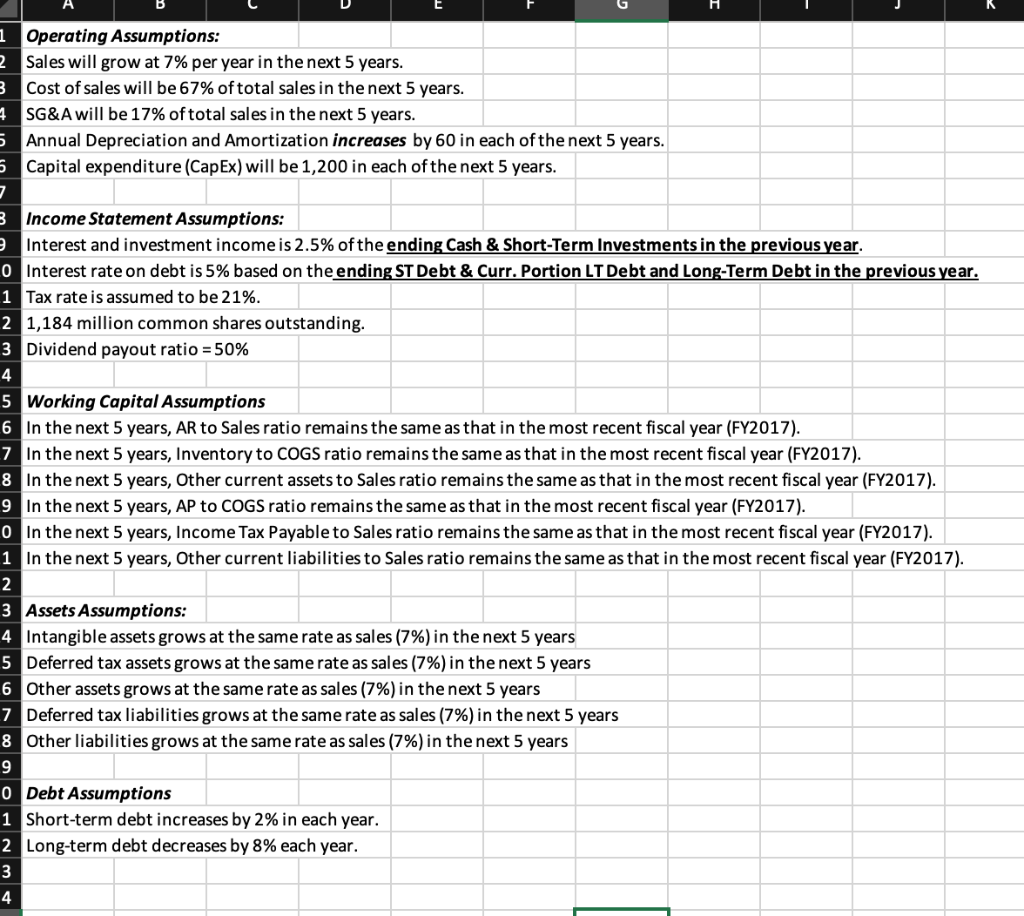
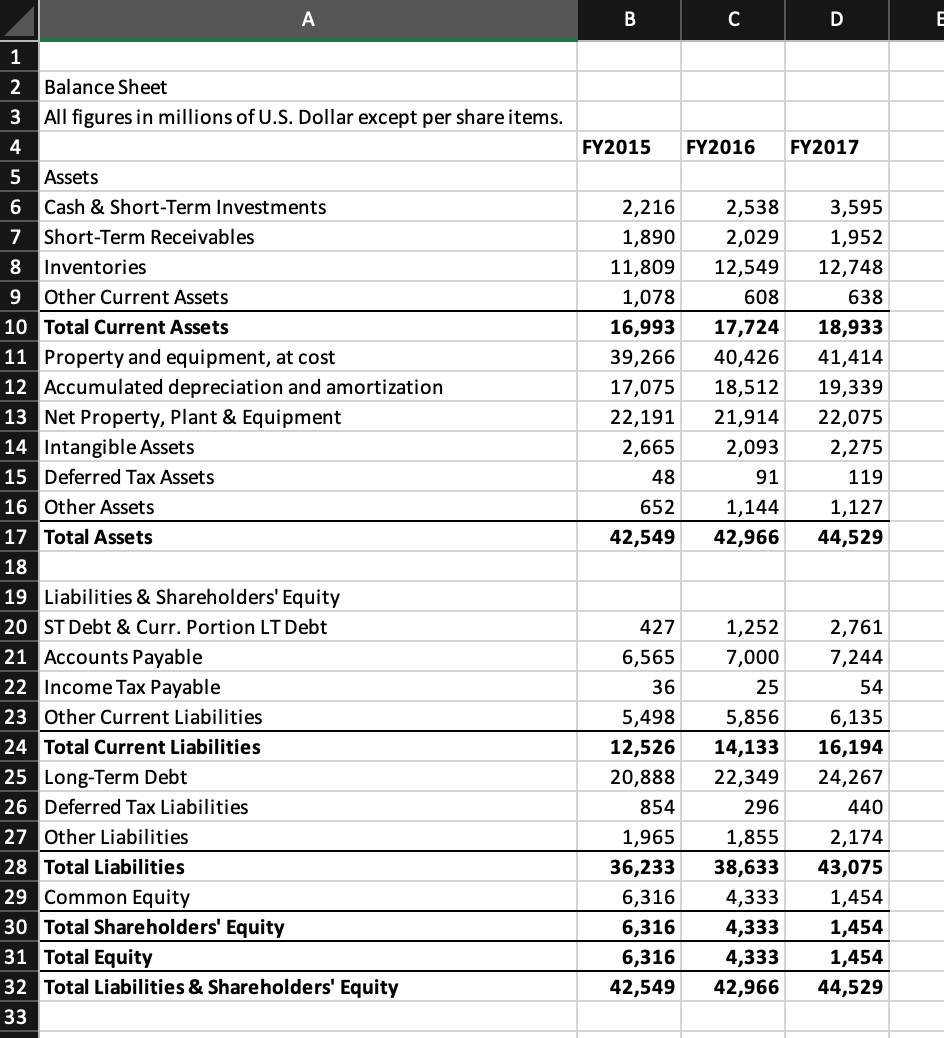
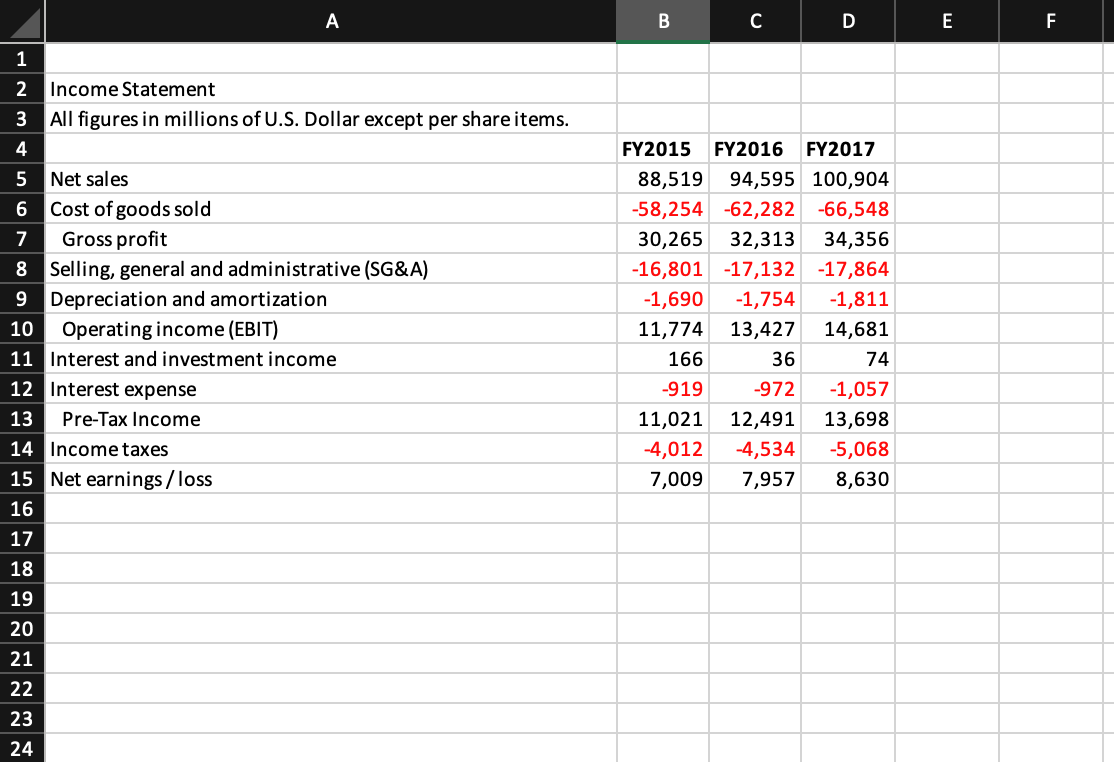
3. Create projected balance sheet for years 2018,2019,2020,2021, and 2022 based on the historical financial statements as well as the information provided in the Assumptions worksheet. ***Hint: Working capital accounts may be calculated based on the working capital ratios in FY2017 (See Working Capital Assumptions). Operating Assumptions: Sales will grow at 7% per year in the next 5 years. Cost of sales will be 67% of total sales in the next 5 years. SG\&A will be 17% of total sales in the next 5 years. Annual Depreciation and Amortization increases by 60 in each of the next 5 years. Capital expenditure (CapEx) will be 1,200 in each of the next 5 years. Income Statement Assumptions: Interest and investment income is 2.5% of the ending Cash & Short-Term Investments in the previous year. Interest rate on debt is 5% based on the ending ST Debt & Curr. Portion LT Debt and Long-Term Debt in the previous year. Tax rate is assumed to be 21%. 21,184 million common shares outstanding. 3 Dividend payout ratio =50% Working Capital Assumptions 6 In the next 5 years, AR to Sales ratio remains the same as that in the most recent fiscal year (FY2017). 7 In the next 5 years, Inventory to COGS ratio remains the same as that in the most recent fiscal year (FY2017). 8 In the next 5 years, Other current assets to Sales ratio remains the same as that in the most recent fiscal year (FY2017). 9 In the next 5 years, AP to COGS ratio remains the same as that in the most recent fiscal year (FY2017). 0 In the next 5 years, Income Tax Payable to Sales ratio remains the same as that in the most recent fiscal year (FY2017). In the next 5 years, Other current liabilities to Sales ratio remains the same as that in the most recent fiscal year (FY2017). 3 Assets Assumptions: 4 Intangible assets grows at the same rate as sales (7%) in the next 5 years 5 Deferred tax assets grows at the same rate as sales (7%) in the next 5 years 6 Other assets grows at the same rate as sales (7%) in the next 5 years 7 Deferred tax liabilities grows at the same rate as sales (7\%) in the next 5 years 8 Other liabilities grows at the same rate as sales (7%) in the next 5 years Debt Assumptions Short-term debt increases by 2% in each year. Long-term debt decreases by 8% each year. A B C D E F Income Statement All figures in millions of U.S. Dollar except per share items. 3. Create projected balance sheet for years 2018,2019,2020,2021, and 2022 based on the historical financial statements as well as the information provided in the Assumptions worksheet. ***Hint: Working capital accounts may be calculated based on the working capital ratios in FY2017 (See Working Capital Assumptions). Operating Assumptions: Sales will grow at 7% per year in the next 5 years. Cost of sales will be 67% of total sales in the next 5 years. SG\&A will be 17% of total sales in the next 5 years. Annual Depreciation and Amortization increases by 60 in each of the next 5 years. Capital expenditure (CapEx) will be 1,200 in each of the next 5 years. Income Statement Assumptions: Interest and investment income is 2.5% of the ending Cash & Short-Term Investments in the previous year. Interest rate on debt is 5% based on the ending ST Debt & Curr. Portion LT Debt and Long-Term Debt in the previous year. Tax rate is assumed to be 21%. 21,184 million common shares outstanding. 3 Dividend payout ratio =50% Working Capital Assumptions 6 In the next 5 years, AR to Sales ratio remains the same as that in the most recent fiscal year (FY2017). 7 In the next 5 years, Inventory to COGS ratio remains the same as that in the most recent fiscal year (FY2017). 8 In the next 5 years, Other current assets to Sales ratio remains the same as that in the most recent fiscal year (FY2017). 9 In the next 5 years, AP to COGS ratio remains the same as that in the most recent fiscal year (FY2017). 0 In the next 5 years, Income Tax Payable to Sales ratio remains the same as that in the most recent fiscal year (FY2017). In the next 5 years, Other current liabilities to Sales ratio remains the same as that in the most recent fiscal year (FY2017). 3 Assets Assumptions: 4 Intangible assets grows at the same rate as sales (7%) in the next 5 years 5 Deferred tax assets grows at the same rate as sales (7%) in the next 5 years 6 Other assets grows at the same rate as sales (7%) in the next 5 years 7 Deferred tax liabilities grows at the same rate as sales (7\%) in the next 5 years 8 Other liabilities grows at the same rate as sales (7%) in the next 5 years Debt Assumptions Short-term debt increases by 2% in each year. Long-term debt decreases by 8% each year. A B C D E F Income Statement All figures in millions of U.S. Dollar except per share items
Step by Step Solution
There are 3 Steps involved in it

Get step-by-step solutions from verified subject matter experts