

Question: Please help due tonight!!! Atternpts Average / 2 5. Elasticity and total revenue The following graph illustrates the weelly demand curve for motorized scooters in
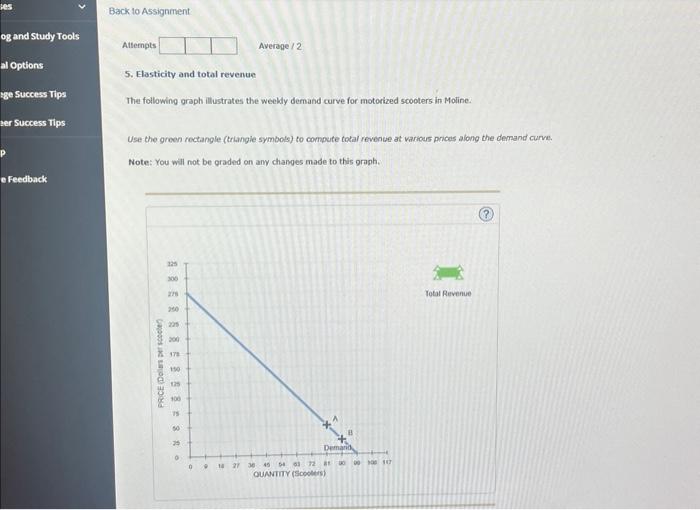
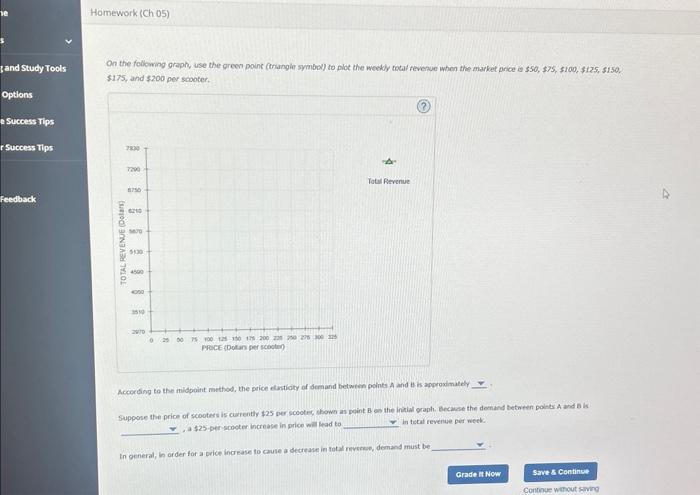
Atternpts Average / 2 5. Elasticity and total revenue The following graph illustrates the weelly demand curve for motorized scooters in Moline. aer Success Tips Use the green rectangle (triangle symbols) to compute total revenue at various pricas along the demand curve. Note: You will not be graded on any chanoes made to this graph. $175, and $200 per scooter. According to the mildpoint method, the price elustioty of Semand betwerm points A and B is approximately , a \$25-perscooter increase in price wall lead to in total revenue per week. In general, in order for a price increase to cause a decresse in total revectes, demand must be
Step by Step Solution
There are 3 Steps involved in it

Get step-by-step solutions from verified subject matter experts