

Question: Please help ! During the past years, which sectors had the largest and smallest percentage increase in profit? Which sectors, if any, experienced losses? What
Please help !
During the past years, which sectors had the largest and smallest percentage increase in profit? Which sectors, if any, experienced losses? What are the implications of the profit changes for expansion or contraction of the particular industries? 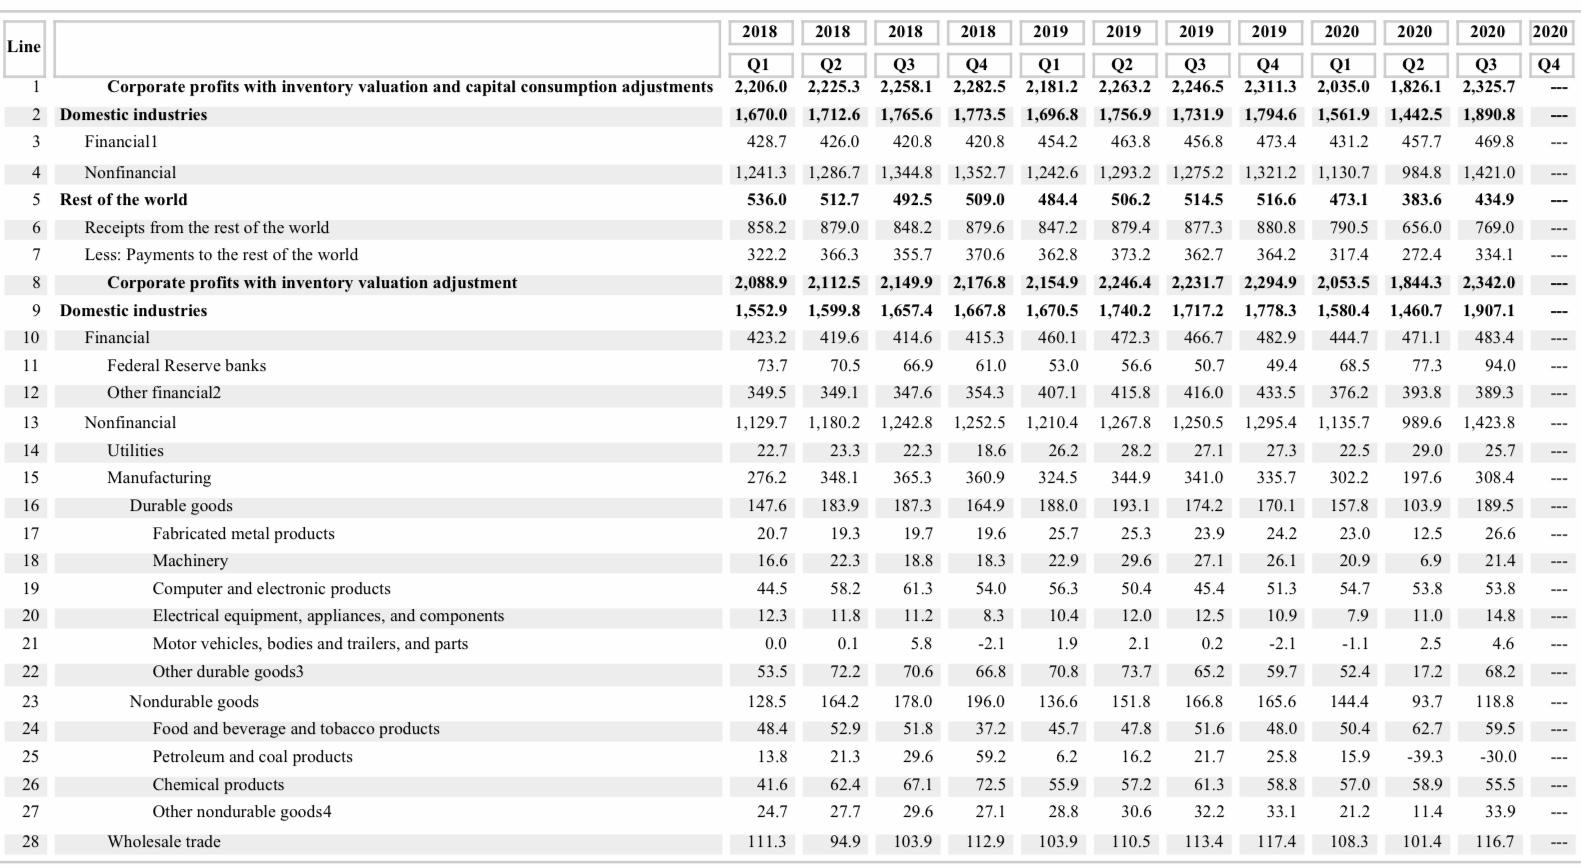
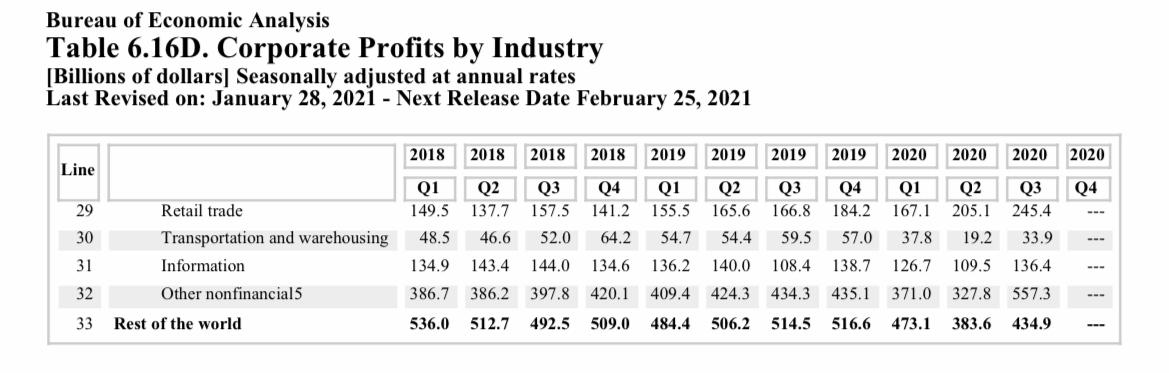
2018 2018 2018 2018 2019 2019 2019 2019 2020 2020 2020 2020 Line Q4 Q3 2,325.7 Q1 Q2 Q3 Q4 Q1 2,206.0 2.225.3 2,258.1 2,282.5 2,181.2 1,670.0 1,712.6 1,765.6 1,773.5 1,696.8 428.7 426.0 420.8 420.8 454.2 Q2 Q3 2,263.2 2,246.5 1,756.9 1,731.9 463.8 456.8 Q4 Q1 Q2 2,311.3 2,035.0 1,826.1 1,794.6 1,561.9 1,442.5 473.4 431.2 457.7 1,890.8 469.8 984.8 1,421.0 1,241.3 1,286.7 536.0 512.7 1,344.8 492.5 1,352.7 509.0 1,242.6 484.4 383.6 434.9 1,293.2 1.275.2 1.321.2 1,130.7 506.2 514.5 516.6 473.1 879.4 877.3 880.8 790.5 373.2 362.7 364.2 317.4 656.0 1 Corporate profits with inventory valuation and capital consumption adjustments 2 Domestic industries 3 Financial1 4 Nonfinancial 5 Rest of the world 6 Receipts from the rest of the world 7 Less: Payments to the rest of the world 8 Corporate profits with inventory valuation adjustment 9 Domestic industries 10 Financial 11 Federal Reserve banks 12 Other financial2 13 Nonfinancial 769.0 879.6 370.6 847.2 362.8 272.4 334.1 2,176.8 2,154.9 1,844.3 2,342.0 --- 1,670.5 1,460.7 1,907.1 1,667.8 415.3 460.1 2,246.4 2,231.7 2,294.9 2,053.5 1,740.2 1,717.2 1,778.3 1,580.4 472.3 466.7 482.9 444.7 56.6 50.7 49.4 68.5 415.8 416.0 433.5 376.2 471.1 483.4 61.0 53.0 77.3 94.0 354.3 407.1 393.8 389.3 - 1,252.5 1,135.7 989.6 858.2 879.0 848.2 322.2 366.3 355.7 2,088.9 2,112.5 2,149.9 1,552.9 1,599.8 1,657.4 423.2 419.6 414.6 73.7 70.5 66.9 349.5 349.1 347.6 1,129.7 1,180.2 1,242.8 22.7 23.3 22.3 276.2 348.1 365.3 147.6 183.9 187.3 19.3 19.7 16.6 22.3 18.8 44.5 58.2 61.3 12.3 11.8 11.2 0.0 0.1 5.8 14 18.6 1,210.4 26.2 324.5 1,267.8 28.2 344.9 1,250.5 27.1 341.0 22.5 15 1.295.4 27.3 335.7 170.1 24.2 1,423.8 25.7 308.4 360.9 29.0 197.6 103.9 302.2 16 164.9 188.0 193.1 174.2 157.8 189.5 20.7 19.6 25.7 25.3 23.9 26.6 17 18 23.0 20.9 12.5 6.9 18.3 22.9 29.6 26.1 27.1 45.4 21.4 53.8 19 54.0 56.3 50.4 51.3 54.7 53.8 20 8.3 10.4 12.0 12.5 10.9 7.9 11.0 14.8 -- 21 Utilities Manufacturing Durable goods Fabricated metal products Machinery Computer and electronic products Electrical equipment, appliances, and components Motor vehicles, bodies and trailers, and parts Other durable goods3 Nondurable goods Food and beverage and tobacco products Petroleum and coal products Chemical products Other nondurable goods4 Wholesale trade -2.1 1.9 2.1 0.2 -1.1 2.5 4.6 -2.1 59.7 22 53.5 72.2 70.6 66.8 70.8 73.7 65.2 52.4 17.2 68.2 23 164.2 178.0 151.8 165.6 144.4 93.7 118.8 128.5 48.4 136,6 45.7 166.8 51.6 24 52.9 51.8 47.8 48.0 50.4 62.7 59.5 - 196.0 37.2 59.2 72.5 25 13.8 21.3 6.2 16.2 21.7 25.8 15.9 -39.3 -30.0 26 41.6 62.4 29.6 67.1 29.6 55.9 61.3 58.8 57.0 58.9 55.5 57.2 30.6 27 24.7 27.7 27.1 28.8 32.2 33.1 21.2 11.4 33.9 28 111.3 94.9 103.9 112.9 103.9 110.5 113.4 117.4 108.3 101.4 116.7 --- Bureau of Economic Analysis Table 6.16D. Corporate Profits by Industry [Billions of dollars] Seasonally adjusted at annual rates Last Revised on: January 28, 2021 - Next Release Date February 25, 2021 2018 2018 2018 2018 2019 2019 2019 2019 2020 2020 2020 2020 Line Q4 Q1 155.5 54.7 29 Q2 165.6 54.4 Q3 166.8 59.5 Q4 184.2 30 57.0 Retail trade Transportation and warehousing Information Other nonfinancials Q1 Q2 Q3 Q4 149.5 137.7 157.5 141.2 48.5 46.6 52.0 64.2 134.9 143.4 144.0 134.6 386.7 386.2 397.8 420.1 536.0 512.7 492.5 509.0 Q1 Q2 Q3 167.1 205.1 245.4 37.8 19.2 33.9 126.7 109.5 136.4 371.0 327.8 557.3 31 136.2 140.0 108.4 138.7 32 409.4 424.3 434.3 435.1 33 Rest of the world 484.4 506.2 514.5 516.6 473.1 383.6 434.9 2018 2018 2018 2018 2019 2019 2019 2019 2020 2020 2020 2020 Line Q4 Q3 2,325.7 Q1 Q2 Q3 Q4 Q1 2,206.0 2.225.3 2,258.1 2,282.5 2,181.2 1,670.0 1,712.6 1,765.6 1,773.5 1,696.8 428.7 426.0 420.8 420.8 454.2 Q2 Q3 2,263.2 2,246.5 1,756.9 1,731.9 463.8 456.8 Q4 Q1 Q2 2,311.3 2,035.0 1,826.1 1,794.6 1,561.9 1,442.5 473.4 431.2 457.7 1,890.8 469.8 984.8 1,421.0 1,241.3 1,286.7 536.0 512.7 1,344.8 492.5 1,352.7 509.0 1,242.6 484.4 383.6 434.9 1,293.2 1.275.2 1.321.2 1,130.7 506.2 514.5 516.6 473.1 879.4 877.3 880.8 790.5 373.2 362.7 364.2 317.4 656.0 1 Corporate profits with inventory valuation and capital consumption adjustments 2 Domestic industries 3 Financial1 4 Nonfinancial 5 Rest of the world 6 Receipts from the rest of the world 7 Less: Payments to the rest of the world 8 Corporate profits with inventory valuation adjustment 9 Domestic industries 10 Financial 11 Federal Reserve banks 12 Other financial2 13 Nonfinancial 769.0 879.6 370.6 847.2 362.8 272.4 334.1 2,176.8 2,154.9 1,844.3 2,342.0 --- 1,670.5 1,460.7 1,907.1 1,667.8 415.3 460.1 2,246.4 2,231.7 2,294.9 2,053.5 1,740.2 1,717.2 1,778.3 1,580.4 472.3 466.7 482.9 444.7 56.6 50.7 49.4 68.5 415.8 416.0 433.5 376.2 471.1 483.4 61.0 53.0 77.3 94.0 354.3 407.1 393.8 389.3 - 1,252.5 1,135.7 989.6 858.2 879.0 848.2 322.2 366.3 355.7 2,088.9 2,112.5 2,149.9 1,552.9 1,599.8 1,657.4 423.2 419.6 414.6 73.7 70.5 66.9 349.5 349.1 347.6 1,129.7 1,180.2 1,242.8 22.7 23.3 22.3 276.2 348.1 365.3 147.6 183.9 187.3 19.3 19.7 16.6 22.3 18.8 44.5 58.2 61.3 12.3 11.8 11.2 0.0 0.1 5.8 14 18.6 1,210.4 26.2 324.5 1,267.8 28.2 344.9 1,250.5 27.1 341.0 22.5 15 1.295.4 27.3 335.7 170.1 24.2 1,423.8 25.7 308.4 360.9 29.0 197.6 103.9 302.2 16 164.9 188.0 193.1 174.2 157.8 189.5 20.7 19.6 25.7 25.3 23.9 26.6 17 18 23.0 20.9 12.5 6.9 18.3 22.9 29.6 26.1 27.1 45.4 21.4 53.8 19 54.0 56.3 50.4 51.3 54.7 53.8 20 8.3 10.4 12.0 12.5 10.9 7.9 11.0 14.8 -- 21 Utilities Manufacturing Durable goods Fabricated metal products Machinery Computer and electronic products Electrical equipment, appliances, and components Motor vehicles, bodies and trailers, and parts Other durable goods3 Nondurable goods Food and beverage and tobacco products Petroleum and coal products Chemical products Other nondurable goods4 Wholesale trade -2.1 1.9 2.1 0.2 -1.1 2.5 4.6 -2.1 59.7 22 53.5 72.2 70.6 66.8 70.8 73.7 65.2 52.4 17.2 68.2 23 164.2 178.0 151.8 165.6 144.4 93.7 118.8 128.5 48.4 136,6 45.7 166.8 51.6 24 52.9 51.8 47.8 48.0 50.4 62.7 59.5 - 196.0 37.2 59.2 72.5 25 13.8 21.3 6.2 16.2 21.7 25.8 15.9 -39.3 -30.0 26 41.6 62.4 29.6 67.1 29.6 55.9 61.3 58.8 57.0 58.9 55.5 57.2 30.6 27 24.7 27.7 27.1 28.8 32.2 33.1 21.2 11.4 33.9 28 111.3 94.9 103.9 112.9 103.9 110.5 113.4 117.4 108.3 101.4 116.7 --- Bureau of Economic Analysis Table 6.16D. Corporate Profits by Industry [Billions of dollars] Seasonally adjusted at annual rates Last Revised on: January 28, 2021 - Next Release Date February 25, 2021 2018 2018 2018 2018 2019 2019 2019 2019 2020 2020 2020 2020 Line Q4 Q1 155.5 54.7 29 Q2 165.6 54.4 Q3 166.8 59.5 Q4 184.2 30 57.0 Retail trade Transportation and warehousing Information Other nonfinancials Q1 Q2 Q3 Q4 149.5 137.7 157.5 141.2 48.5 46.6 52.0 64.2 134.9 143.4 144.0 134.6 386.7 386.2 397.8 420.1 536.0 512.7 492.5 509.0 Q1 Q2 Q3 167.1 205.1 245.4 37.8 19.2 33.9 126.7 109.5 136.4 371.0 327.8 557.3 31 136.2 140.0 108.4 138.7 32 409.4 424.3 434.3 435.1 33 Rest of the world 484.4 506.2 514.5 516.6 473.1 383.6 434.9
Step by Step Solution
There are 3 Steps involved in it

Get step-by-step solutions from verified subject matter experts