

Question: please help!! EBIT-EPS and preferred stock Litho-Print is considering two possible capital structures, A and B, shown in the following table, Assume a 40% tax
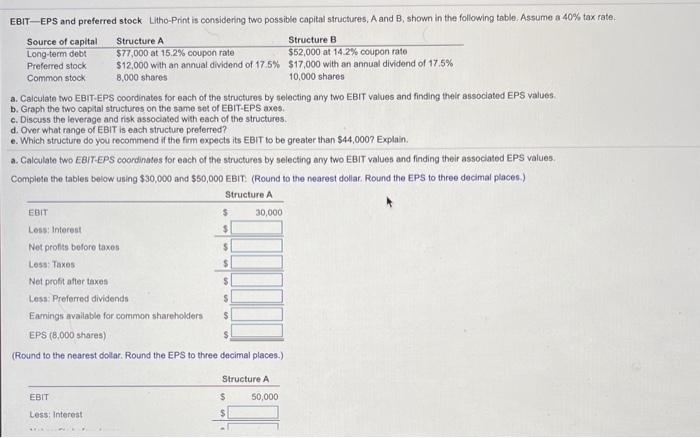
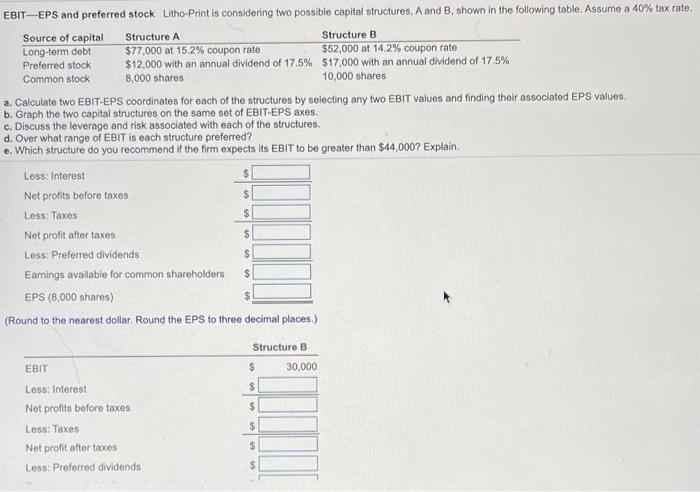
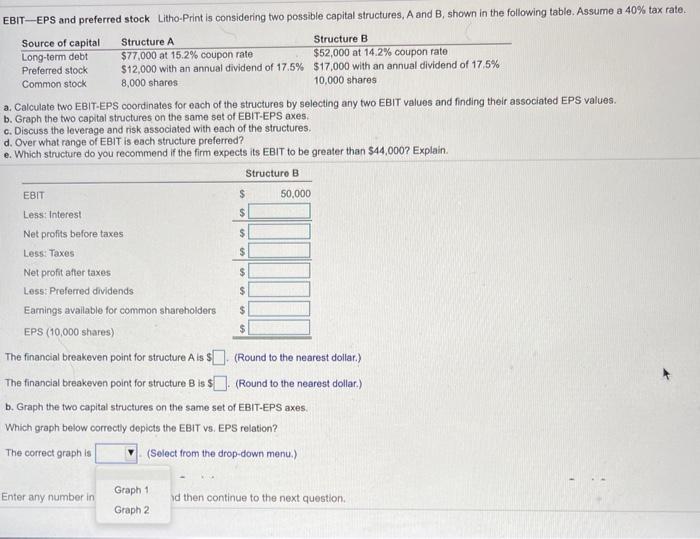
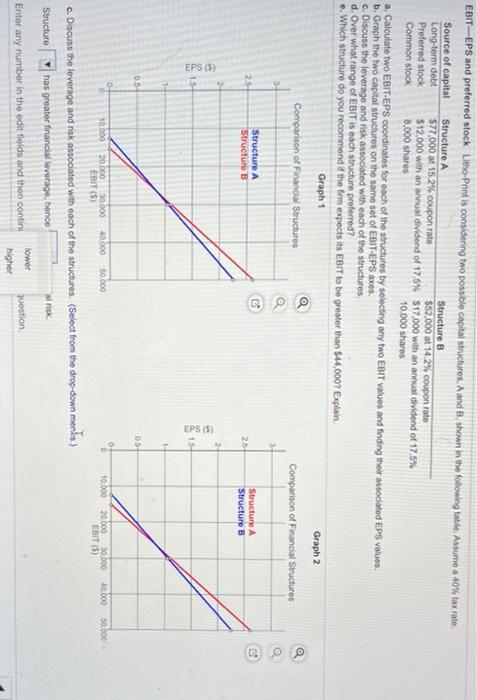
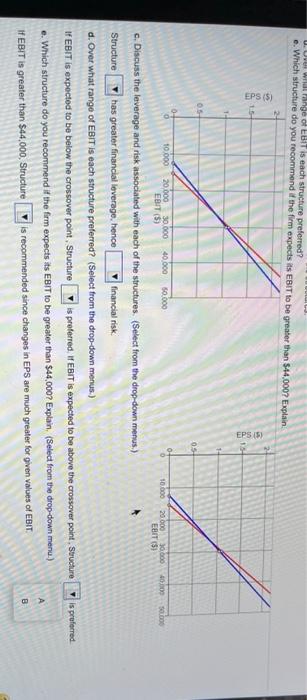
EBIT-EPS and preferred stock Litho-Print is considering two possible capital structures, A and B, shown in the following table, Assume a 40% tax rate, Source of capital Structure A Structure B Long-term debt $77,000 at 15.2% coupon rate $52,000 at 14.2% coupon rato Preferred stock $12,000 with an annual dividend of 17.5% $17,000 with an annual dividend of 17.5% Common stock 8,000 shares 10,000 shares a. Calculate two EBIT.EPS coordinates for each of the structures by selecting any two EBIT values and finding their associated EPS values b. Graph the two capital structures on the same set of EBIT-EPS axes c. Discuss the leverage and risk associated with each of the structures d. Over what range of EBIT is each structure preferred? e. Which structure do you recommand if the firm expects its EBIT to be greater than $44,000? Explain. a. Calculate two EBIT.EPS coordinates for each of the structures by selecting any two EBIT values and finding their associated EPS values. Complete the tables below using $30,000 and $50,000 EBIT. (Round to the nearest dollar. Round the EPS to three decimal places) Structure A EBIT $ 30,000 Loss Interest Not profits before taxes Losa: Taxes Net profit after taxes Lesa: Preferred dividendo $ Earnings available for common shareholders EPS (8,000 shares) (Round to the nearest dollar. Round the EPS to three decimal places.) $ $ $ $ $ Structure A $ 50,000 EBIT Less: Interest $ EBIT-EPS and preferred stock Litho-Print is considering two possible capital structures, A and B shown in the following table. Assume a 40% tax rate Source of capital Structure A Structure B Long-term debt $77,000 at 15.2% coupon rato $52,000 at 14.2% coupon rate Preferred stock $12,000 with an annual dividend of 17.5% $17.000 with an annual dividend of 17.5% Common stock 8,000 shares 10,000 shares a. Calculate two EBIT-EPS coordinates for each of the structures by selecting any two EBIT Values and finding thoir associated EPS values. b. Graph the two capital structures on the same set of EBIT-EPS axes c. Discuss the leverage and risk associated with each of the structures d. Over what range of EBIT is each structure preferred? e. Which structure do you recommend if the firm expects its EBIT to be greater than $44,000? Explain. Less: Interest Net profits before taxes $ Less: Taxes $ Net profit after taxes $ Less: Preferred dividends Earnings available for common shareholders EPS (8,000 shares) (Round to the nearest dollar. Round the EPS to three decimal places.) $ $ Structure B $ 30,000 EBIT $ $ Less: Interest Net profits before taxes Less; Taxes Net profit after taxes Less: Preferred dividends $ $ $ EBIT-EPS and preferred stock Litho-Print is considering two possible capital structures, A and B, shown in the following table. Assume a 40% tax rate. Source of capital Structure A Structure B Long-term debt $77,000 at 15.2% coupon rate $52,000 at 14.2% coupon rate Preferred stock $12,000 with an annual dividend of 17.5% $17,000 with an annual dividend of 17,5% Common stock 8,000 shares 10,000 shares a. Calculate two EBIT-EPS coordinates for each of the structures by selecting any two EBIT values and finding their associated EPS values. b. Graph the two capital structures on the same set of EBIT-EPS axes c. Discuss the leverage and risk associated with each of the structures, d. Over what range of EBIT is each structure preferred? e. Which structure do you recommend If the firm expects its EBIT to be greater than $44,000? Explain Structure B $ $ EBIT S 50,000 Less: Interest Net profits before taxes $ Less: Taxes $ Net profit after taxes Less: Preferred dividends $ Earnings available for common shareholders $ EPS (10,000 shares) The financial breakeven point for structure Als $1. (Round to the nearest dollar.) The financial breakeven point for structure Bis (Round to the nearest dollar.) b. Graph the two capital structures on the same set of EBIT-EPS axes. Which graph below correctly depicts the EBIT vs. EPS relation? The correct graph is (Select from the drop-down menu.) $ Graph 1 Enter any number in d then continue to the next question Graph 2 EBIT-EPS and preferred stock Litho Print is considering two possible capital structures. A and B shown in the following table. Assume a 40% tax rate. Source of capital Structure A Structure B Long-term debt $77.000 at 152% coupon rate $52,000 at 142% coupon rate Preferred stock $12,000 with an annual dividend of 17.5% 517.000 with an annual dividend of 175% Common stock 8,000 shares 10.000 shares a. Calculate two EBIT-EPS coordinates for each of the structures by selecting any two EBIT values and finding their associated EPS values. b. Graph the two capital structures on the same set of EBIT-EPS axes c. Discuss the leverage and risk associated with each of the structures d. Over what range of EBIT is each structure preferred? e. Which structure do you recommend if the firm expects ts EBIT to be greater than $44.000? Explain Graph 1 Graph 2 Comparison of Financial Structures Comparison of Financial Structures 31 Structure A Structure A 25 25 Structure Structure B o 2 EPS (5) EPS 1 OS 30.000 0000 50.000 10.000 20.000 50.000 EBIT (5) 20.000 50.000 40.000 EBIT (5) 50.000 c. Discuss the loverage and risk associated with each of the structures. (Select from the drop-down monks.) has greater financial Severage, hence Enter any number in the edit fields and then continu Structure al risk lower question higher U. Uvi W. Pange of EBIT is each structure preferred? e. Which structure do you recommend the firm expects its EBIT to be greater than $14.000? Explain EPS (5) 15 15 T 05 0- 10/000 4000 sotho 10.000 20.000 30.000 40.000 50.000 EBIT (5) 20.000.000 EBIT 5 c. Discuss the leverage and risk associated with each of the structures. (Select from the drop-down menus.) Structure has greater financial loverage, hence financial risk. d. Over what range of EBIT is each structure preferred? (Select from the drop-down menus.) IF EBIT is expected to be below the crossover point. Structure is preferred. I EBIT is expected to be above the crossover point, Structure M is preferred e. Which structure do you recommend if the firm expects its EBIT to be greater than $44.000? Explain, (Select from the drop-down menu.) HEBIT is greater than $44,000, Structure is recommended since changes in EPS are much greater for given values of EBIT B
Step by Step Solution
There are 3 Steps involved in it

Get step-by-step solutions from verified subject matter experts