

Question: Please help, every tutor has gotten this wrong Instructions: The following is the recorded earthquakes on South Carolina from August, 2016 to February, 2017. Use
Please help, every tutor has gotten this wrong
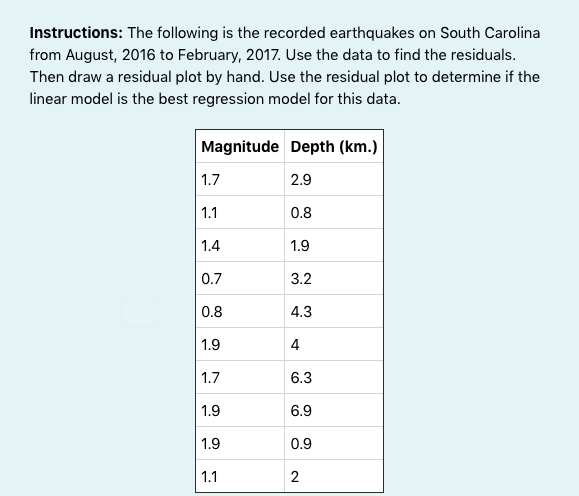
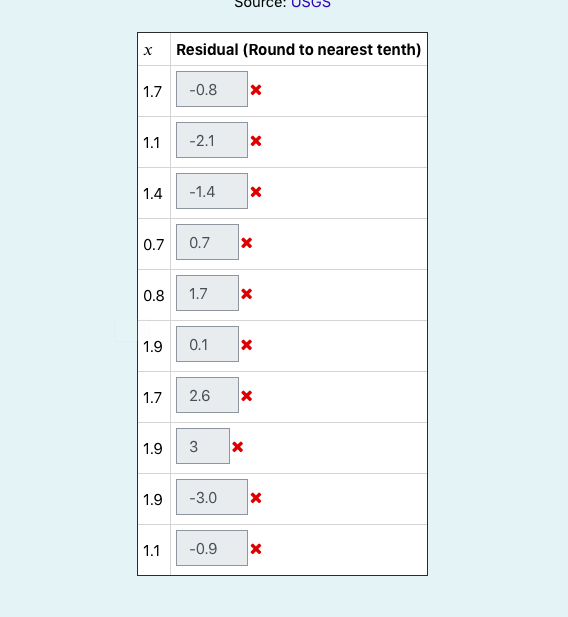
Instructions: The following is the recorded earthquakes on South Carolina from August, 2016 to February, 2017. Use the data to find the residuals. Then draw a residual plot by hand. Use the residual plot to determine if the linear model is the best regression model for this data. Magnitude Depth (km.) 1.7 2.9 1.1 0.8 1.4 1.9 0.7 3.2 0.8 4.3 1.9 4 1.7 6.3 1.9 6.9 1.9 0.9 1.1 2Source: X Residual (Round to nearest tenth) 1.7 -0.8 X 1.1 -2.1 X 1.4 -1.4 X 0.7 0.7 X 0.8 1.7 X 1.9 0.1 1.7 2.6 1.9 3 X 1.9 -3.0 X 1.1 -0.9 X
Step by Step Solution
There are 3 Steps involved in it
1 Expert Approved Answer
Step: 1 Unlock

Question Has Been Solved by an Expert!
Get step-by-step solutions from verified subject matter experts
Step: 2 Unlock
Step: 3 Unlock