

Question: Please Help! Facult des sciences sociales I Faculty ofSocial Sciences Dpartement de science conomique uOttawa Department of Economics ANALYSIS OF ECONOMIC AND SOCIAL DATA ECO


Please Help!

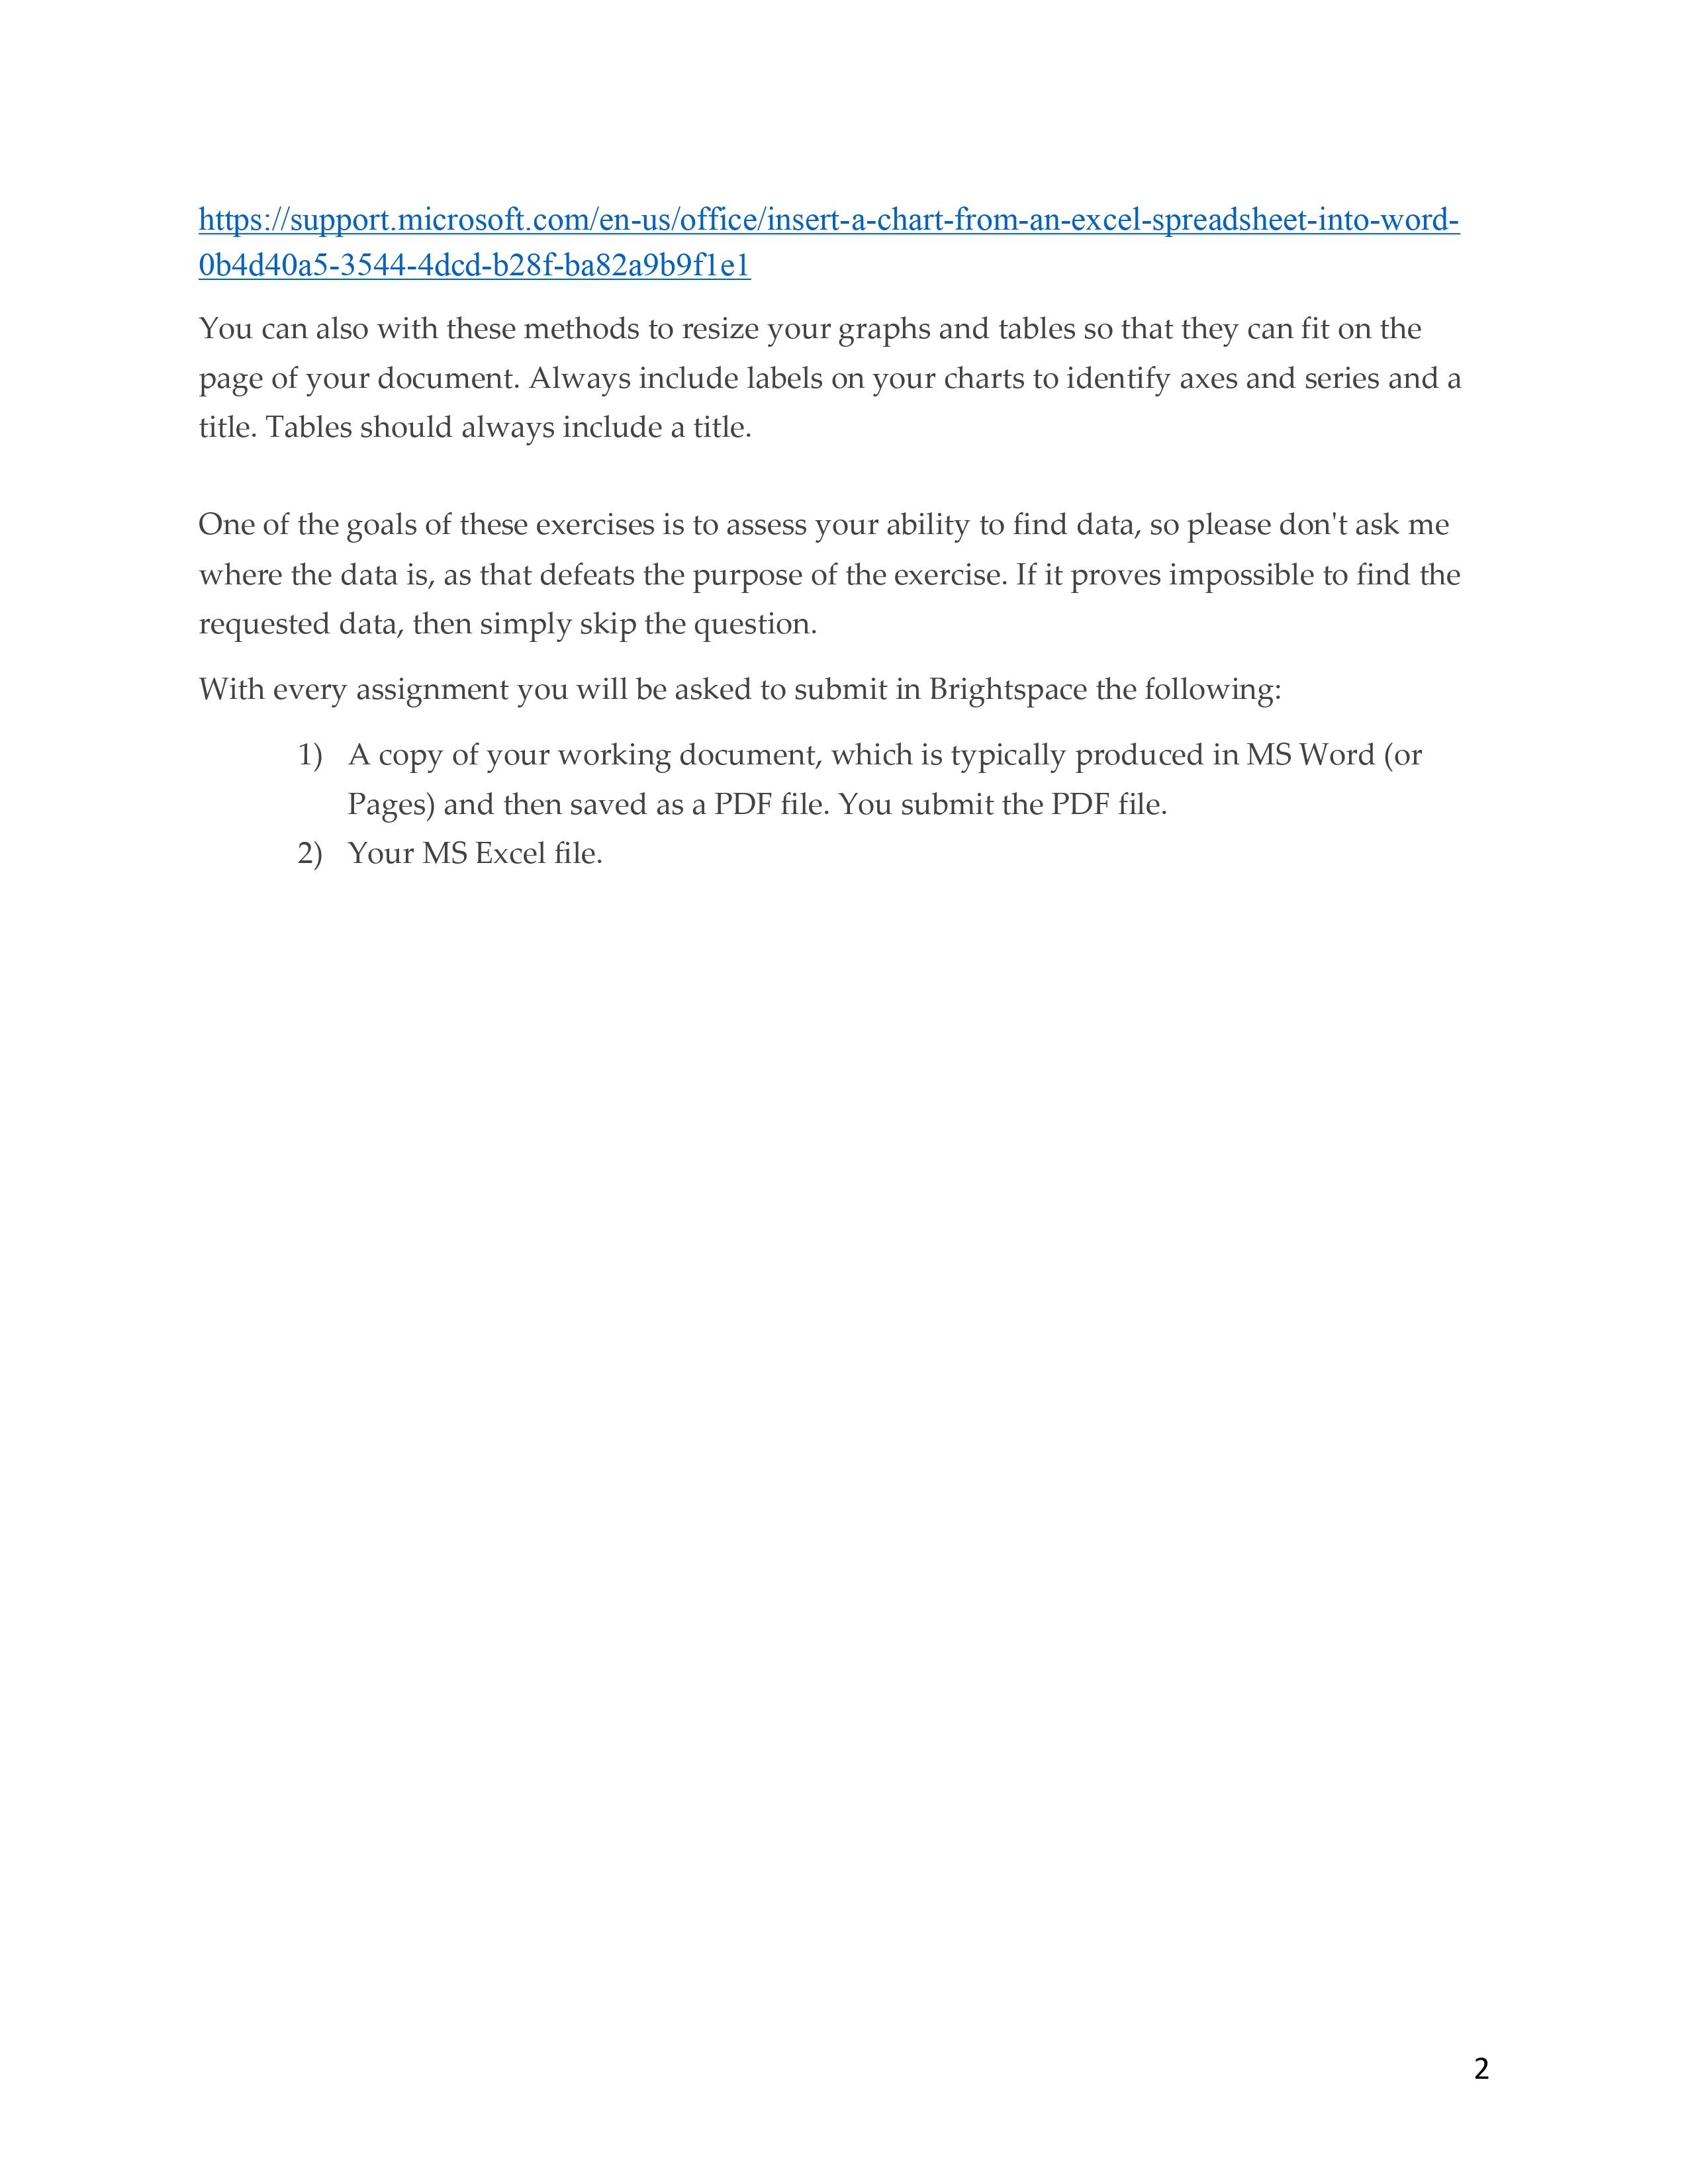

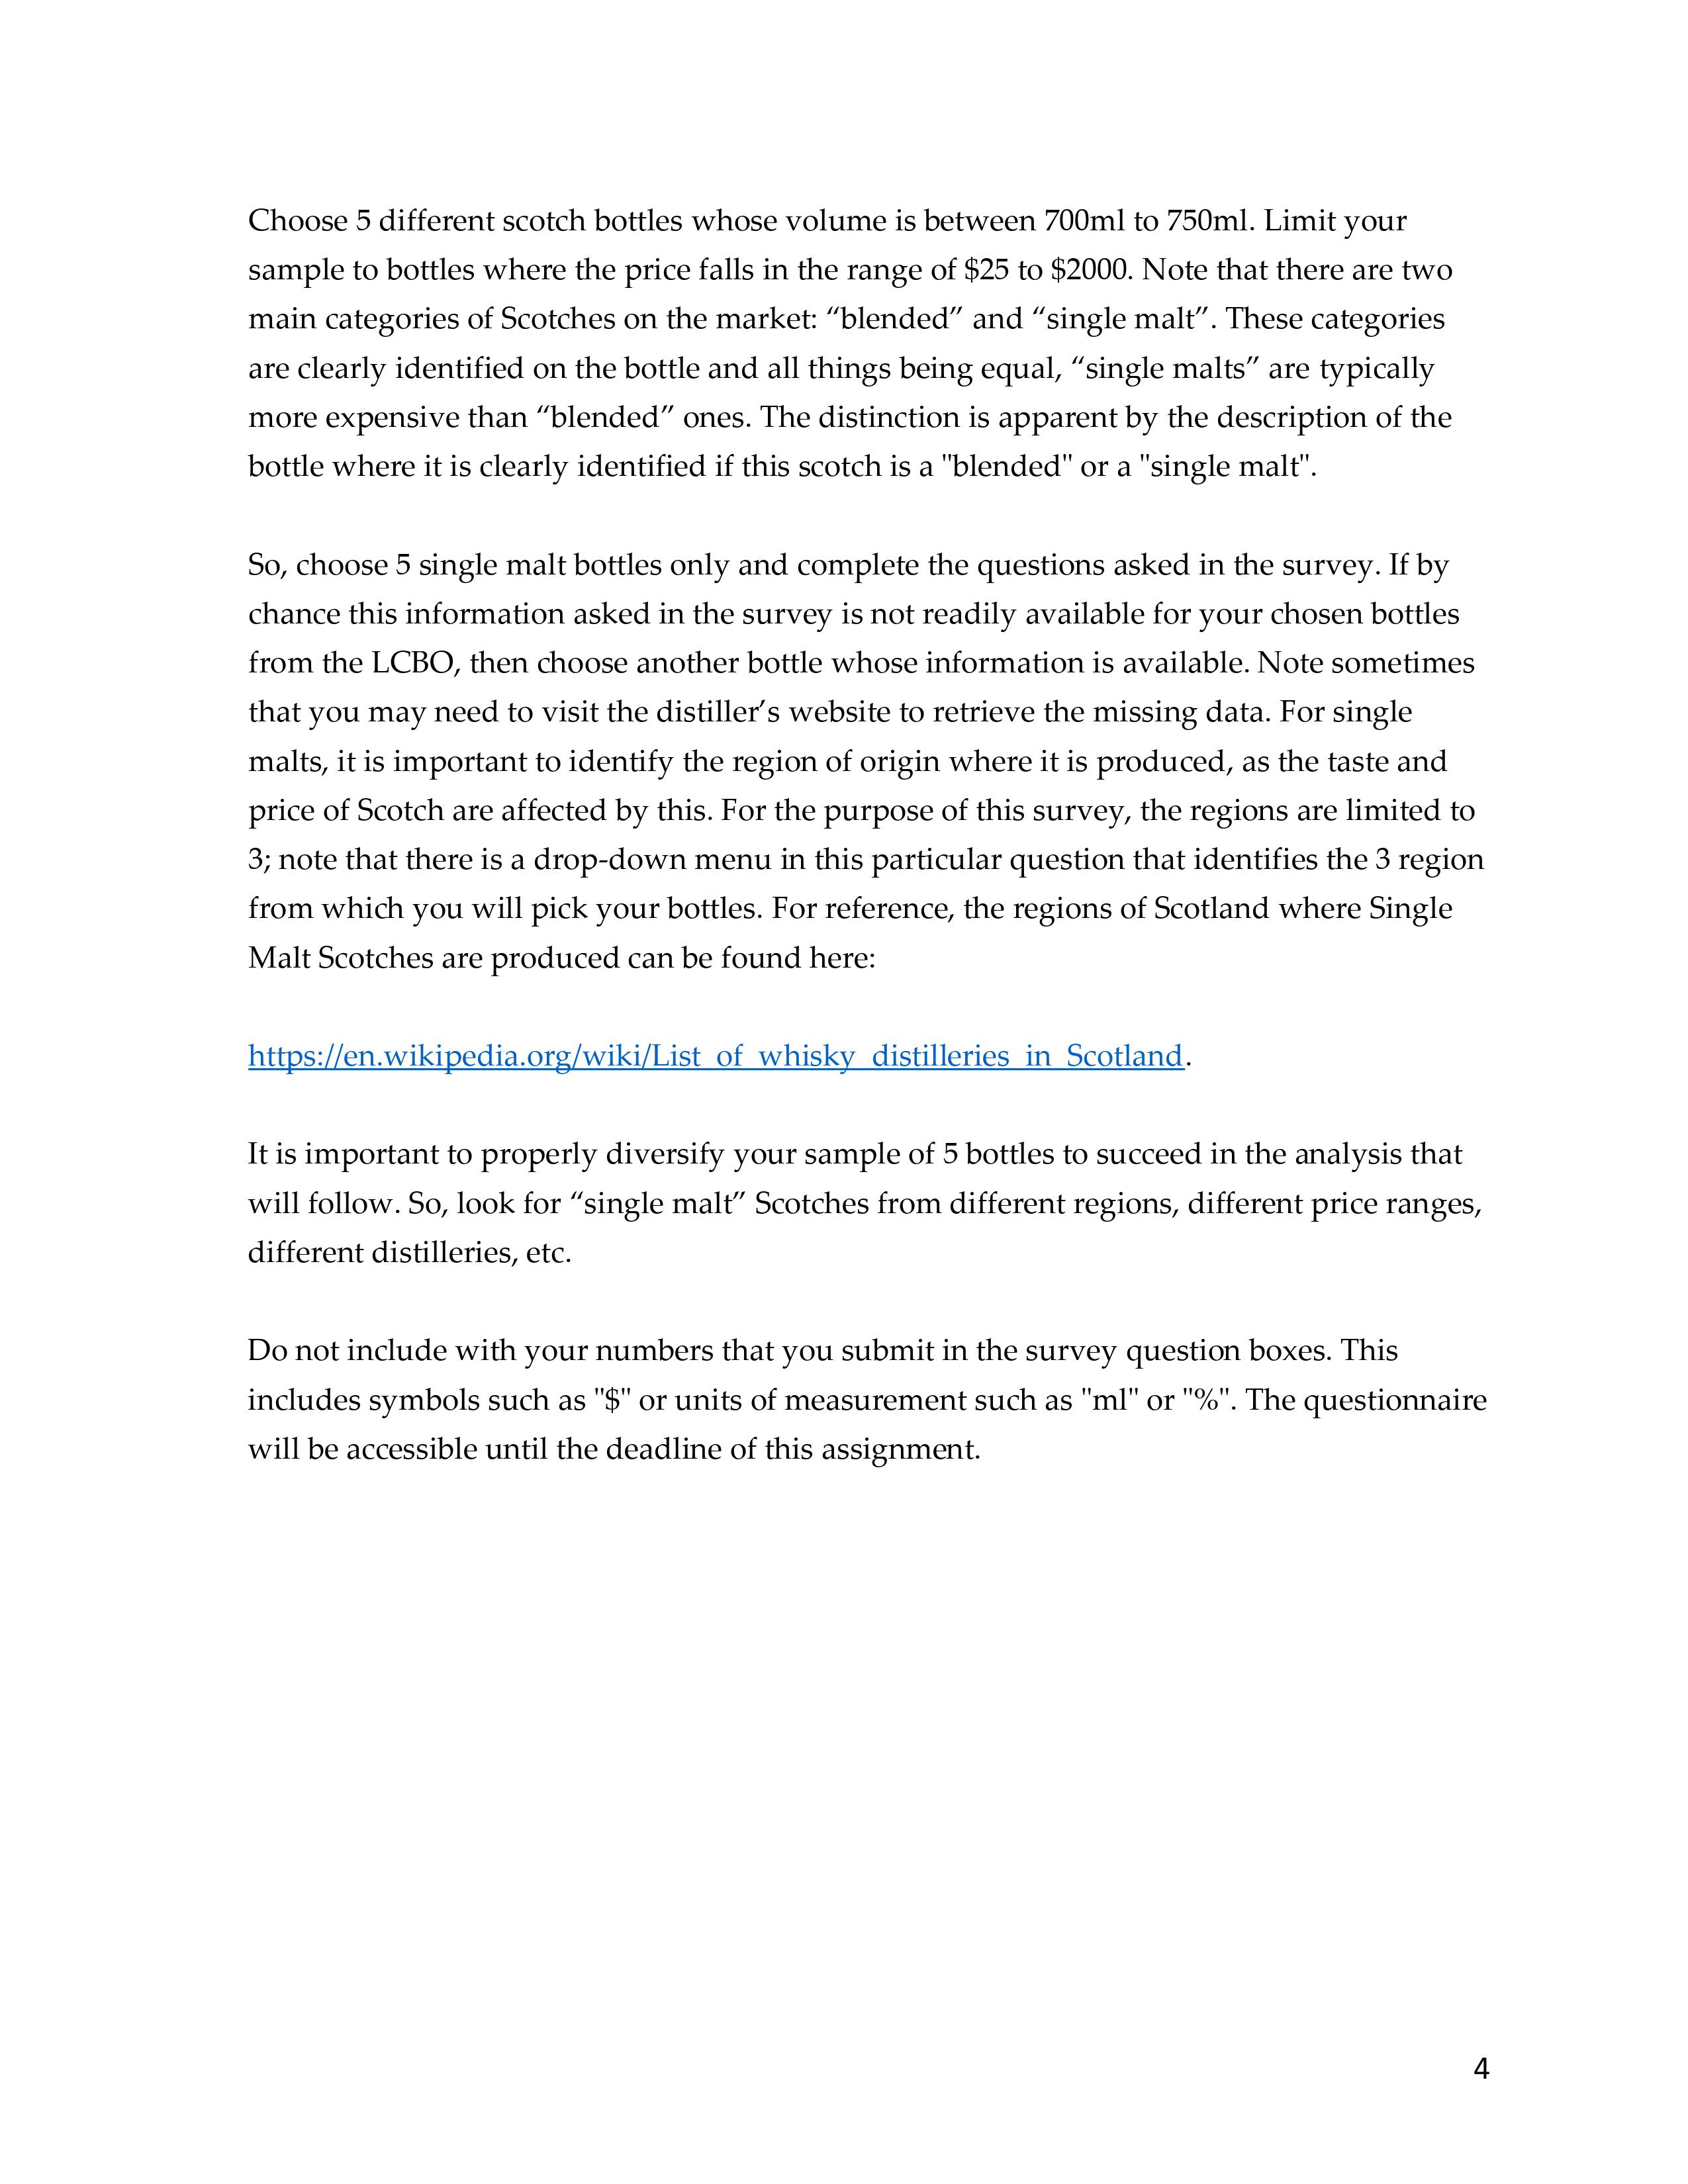
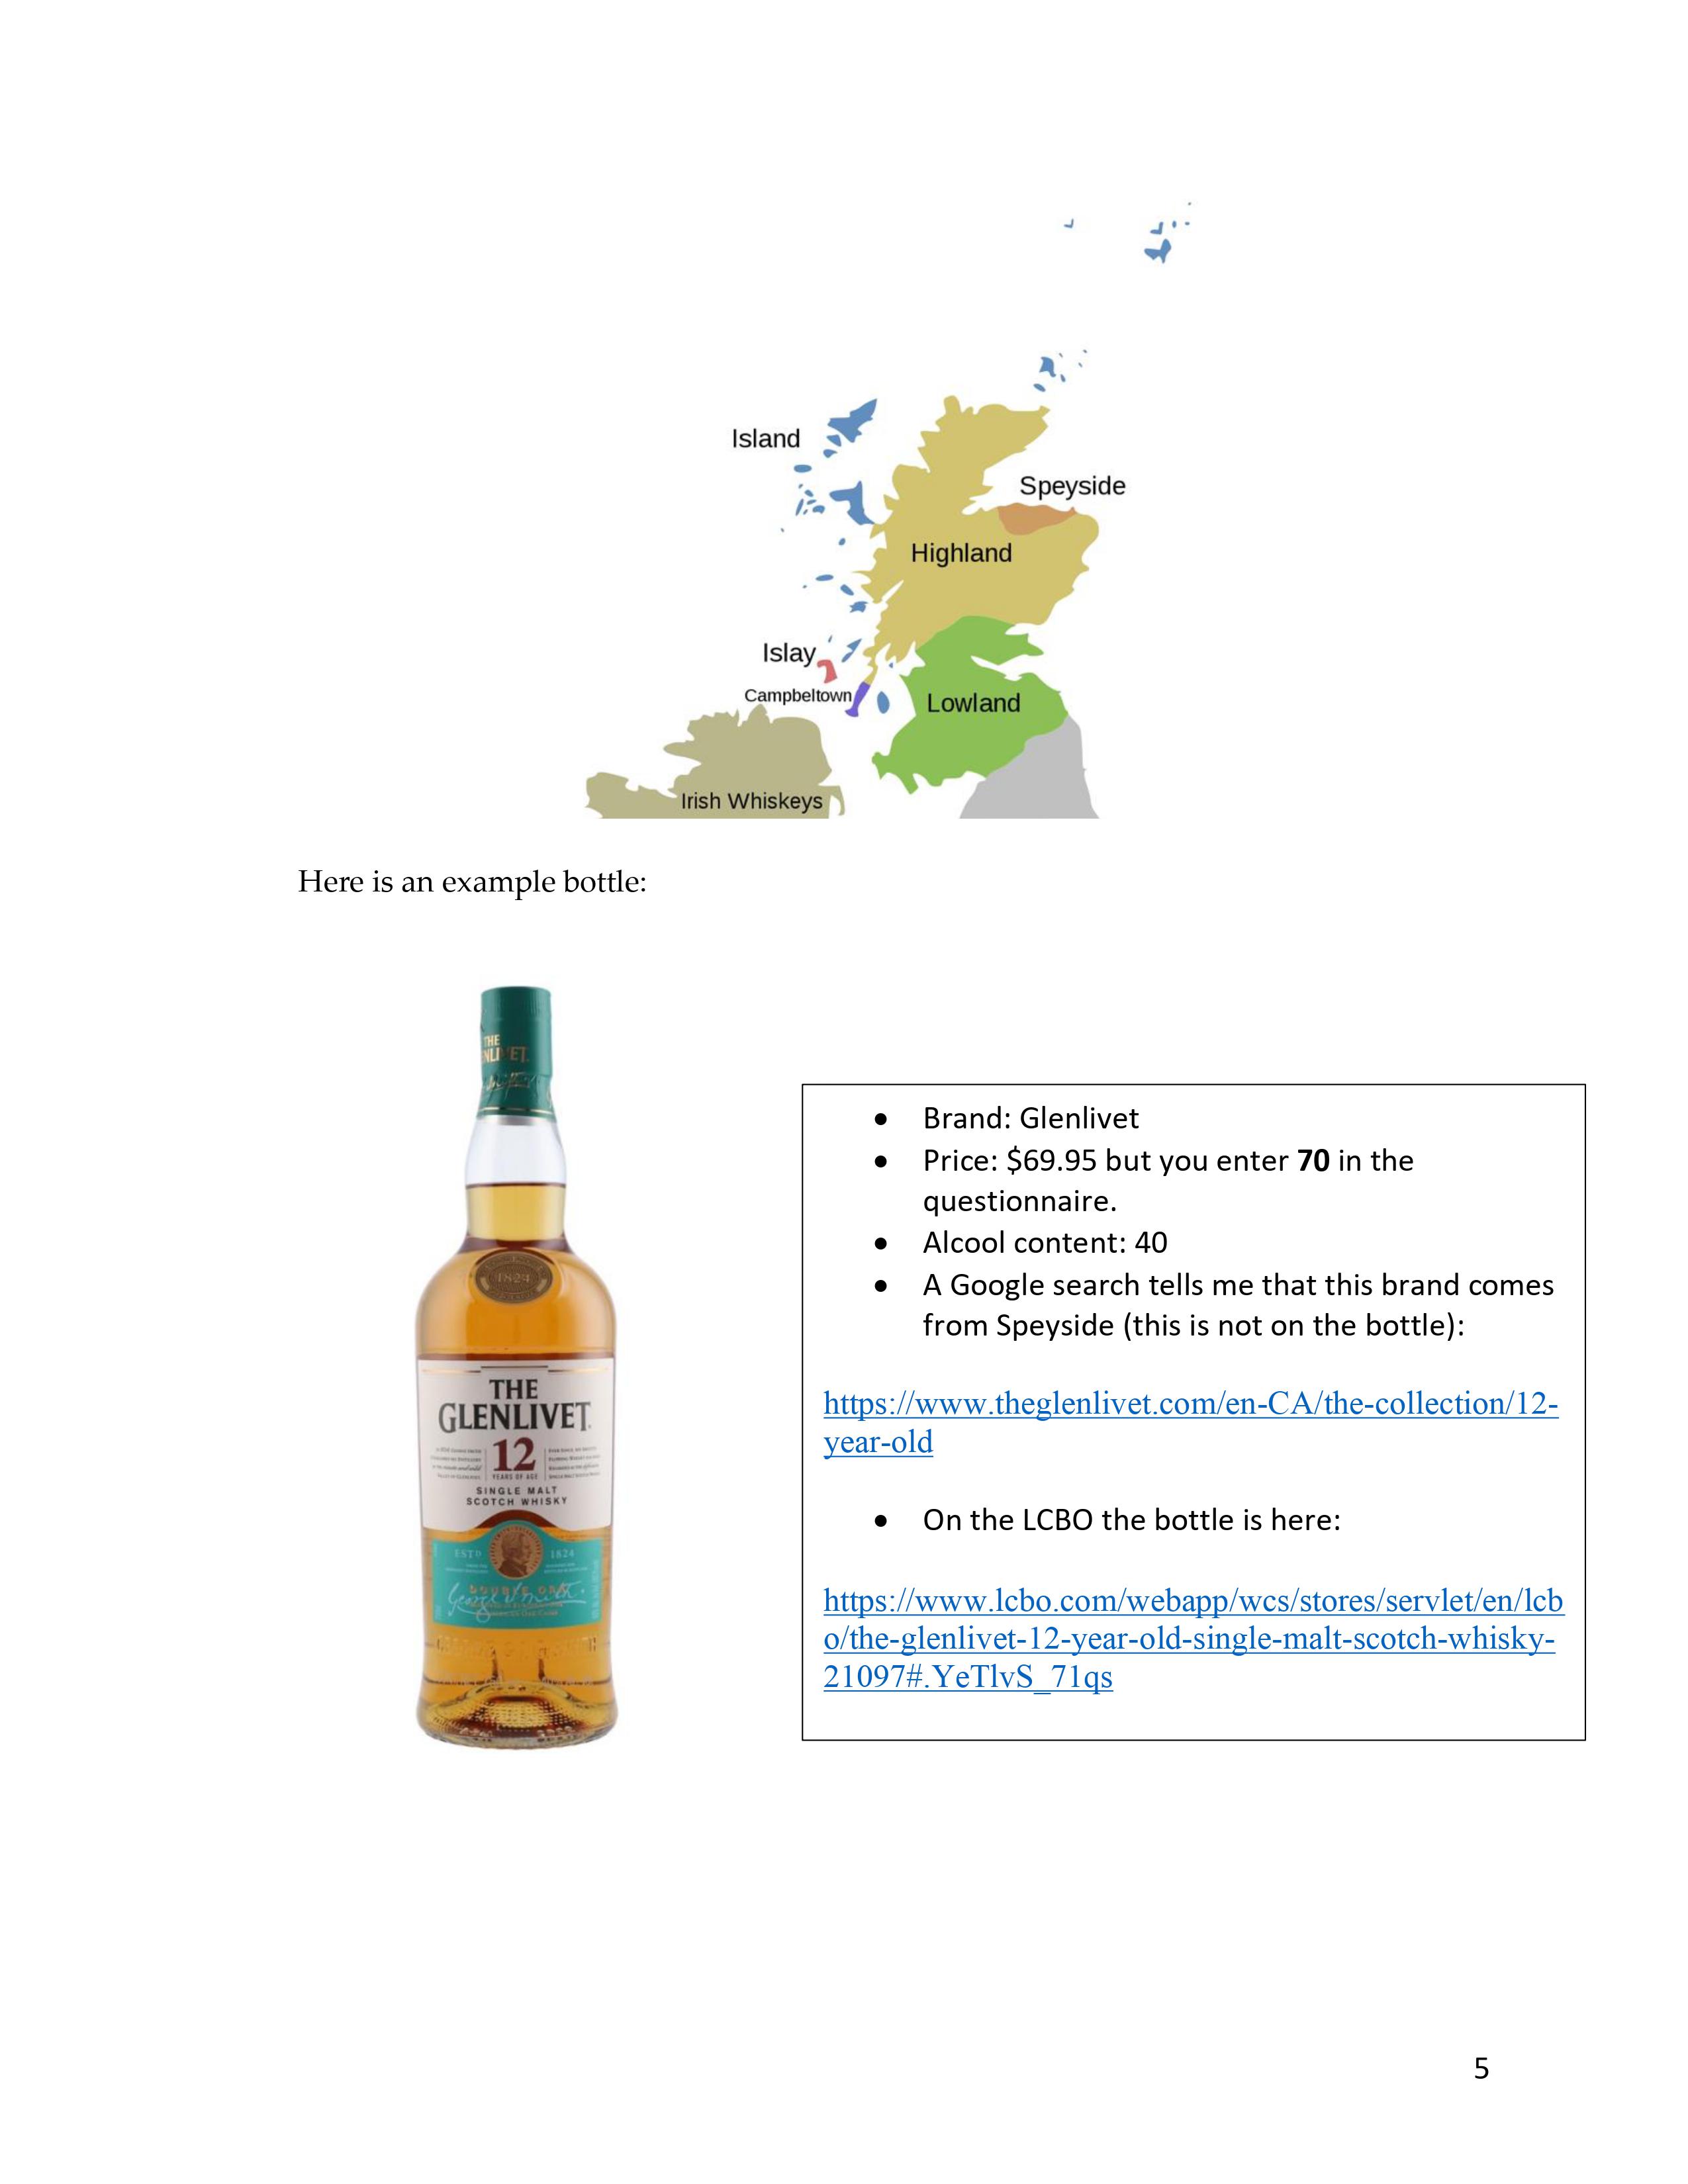

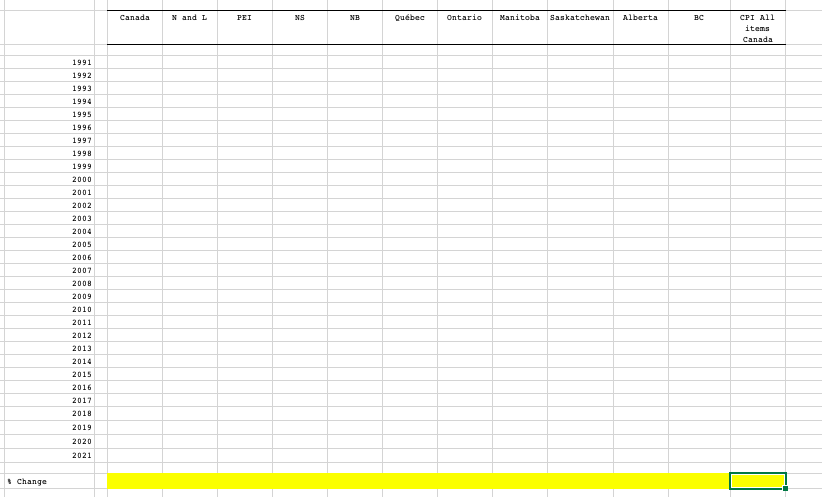


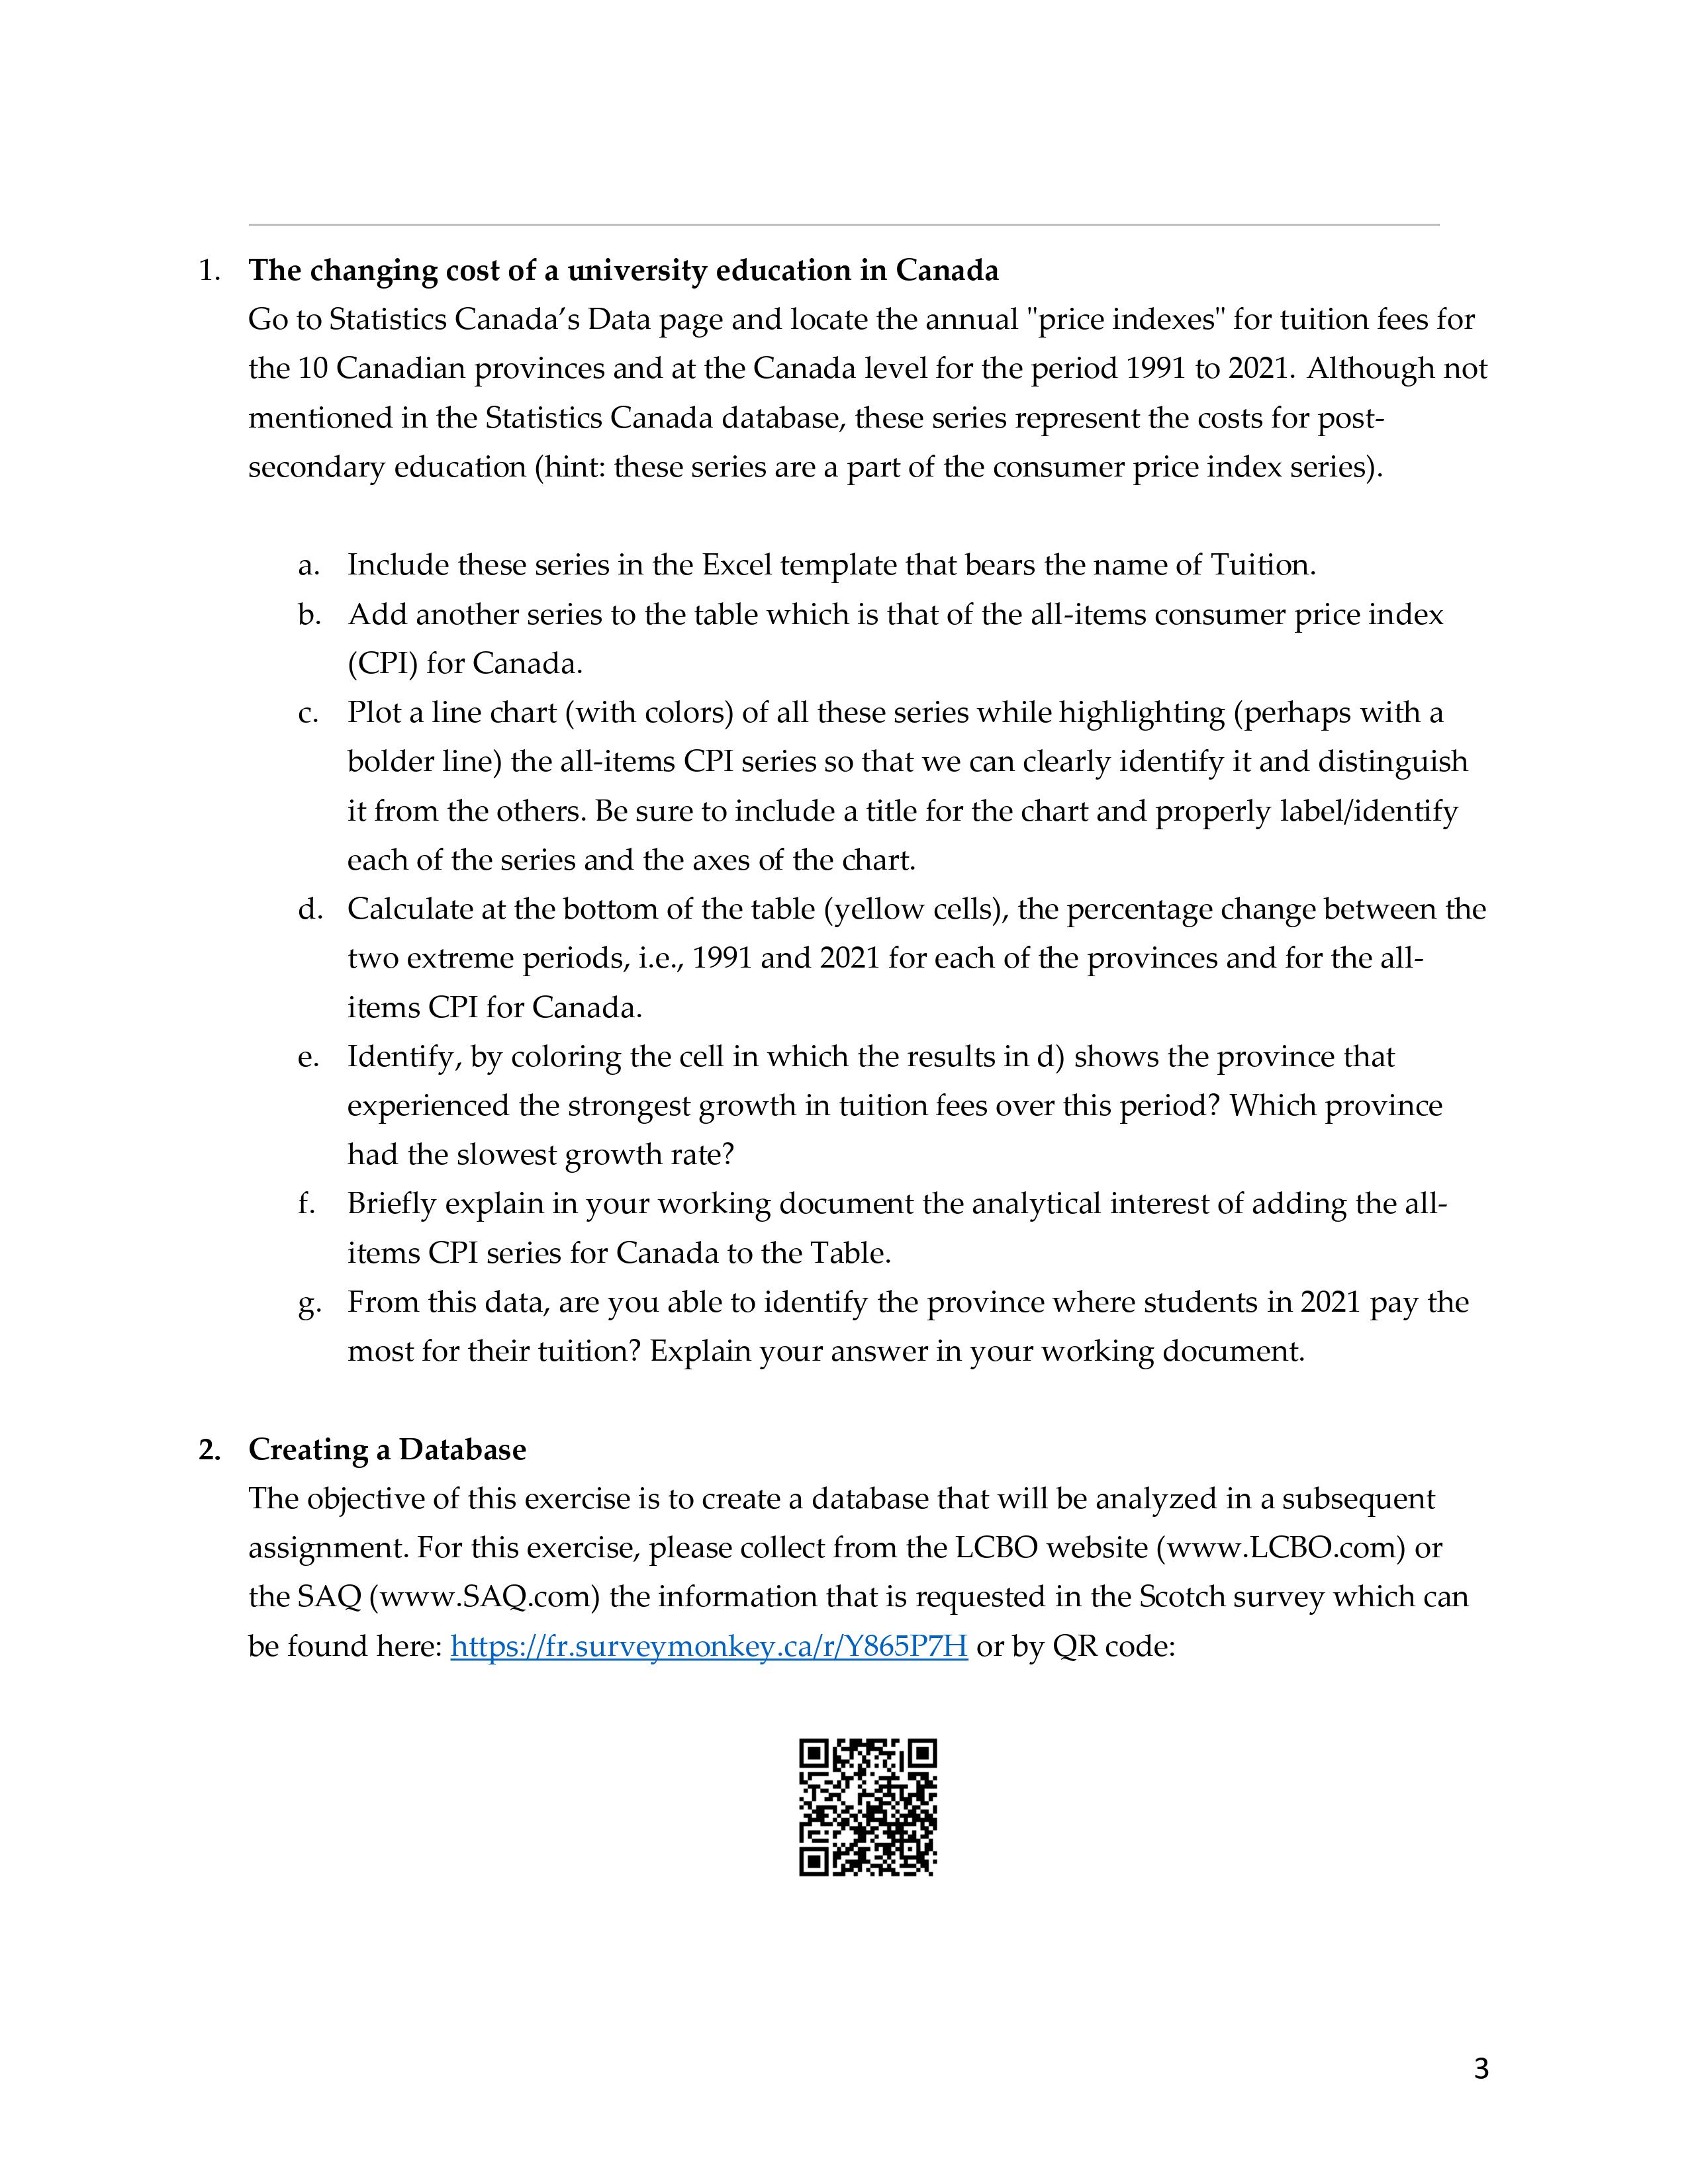
Facult des sciences sociales I Faculty ofSocial Sciences Dpartement de science conomique uOttawa Department of Economics ANALYSIS OF ECONOMIC AND SOCIAL DATA ECO 2147 SUMMER 2022 ASSIGNMENT 1 (TP1) DEADLINE: MAY 15, 23H30 THE GOAL OF THIS FIRST ASSIGNMENT IS TO LEARN HOW TO EXTRACT AND MANIPULATE DATA Instructions: Please respect to avoid serious penalties This is an individual assignment. You can however consult each other to work on the assignment but you must return your own individual copy. Under no circumstances can you submit your assignment by email; you must submit it on Brightspace. Tardiness will be penalized at the rate of a 10% deduction per day up to a maximum of 3 days after which time no assignment will be accepted. Include with your working document a typed cover page that is produced with word processing software such as MS Word or Pages; do not submit a handwritten cover page. Your last name (family name) should be in caps so that we can best identify you. A sample cover page can be found here: https:z[socialsciencesuottawacalpublic- international-affairs sites socialsciences.uottawa.ca. ublic-internationalaffairs files idelines- 20110217 ritin ands leGuide2010-2011 001. df Which is a sub section of this very good writing guide which I think every university-level student should read. I would also like to point out that a subset of the exercises will be corrected and not the entire assignment due to lack of resources. However, you must attempt all the exercises, otherwise points will be deducted for incomplete work. Note that when you construct graphs and tables in MS Excel, you will sometimes be instructed to include them in your working document unless otherwise specified. There are several ways to go about transferring charts and tables from an Excel file to the working document. Here's an example (the same approach is used if you're using Pages): https://support.microsoft.com/en-us/office/insert-a-chart-from-an-excel-spreadsheet-into-word- 0b4d40a5-3544-4dcd-b28f-ba82a9b9flel You can also with these methods to resize your graphs and tables so that they can fit on the page of your document. Always include labels on your charts to identify axes and series and a title. Tables should always include a title. One of the goals of these exercises is to assess your ability to find data, so please don't ask me where the data is, as that defeats the purpose of the exercise. If it proves impossible to find the requested data, then simply skip the question. With every assignment you will be asked to submit in Brightspace the following: 1) A copy of your working document, which is typically produced in MS Word (or Pages) and then saved as a PDF file. You submit the PDF file. 2) Your MS Excel file. 21. The changing cost of a university education in Canada Go to Statistics Canada's Data page and locate the annual "price indexes" for tuition fees for the 10 Canadian provinces and at the Canada level for the period 1991 to 2021. Although not mentioned in the Statistics Canada database, these series represent the costs for post- secondary education (hint: these series are a part of the consumer price index series). a. Include these series in the Excel template that bears the name of Tuition. b. Add another series to the table which is that of the allitems consumer price index (CPI) for Canada. c. Plot a line chart (with colors) of all these series while highlighting (perhaps with a bolder line) the all-items CPI series so that we can clearly identify it and distinguish it from the others. Be sure to include a title for the chart and properly label/identify each of the series and the axes of the chart. d. Calculate at the bottom of the table (yellow cells), the percentage change between the two extreme periods, i.e., I99] and 2021 for each of the provinces and for the all items CPI for Canada. e. ldentify, by coloring the cell in which the results in d) shows the province that experienced the strongest growth in tuition fees over this period? Which province had the slowest growth rate? f. Briefly explain in your working document the analytical interest of adding the all- items CPI series for Canada to the Table. g. From this data, are you able to identify the province where students in 2021 pay the most for their tuition? Explain your answer in your working document. 2. Creating a Database The objective of this exercise is to create a database that will be analyzed in a subsequent assignment. For this exercise, please collect from the LCBO website (www.LCBO.com) or the SAQ (www.SAQ.com) the information that is requested in the Scotch survey which can be found here: https://fr.surveymonl
Step by Step Solution
There are 3 Steps involved in it

Get step-by-step solutions from verified subject matter experts